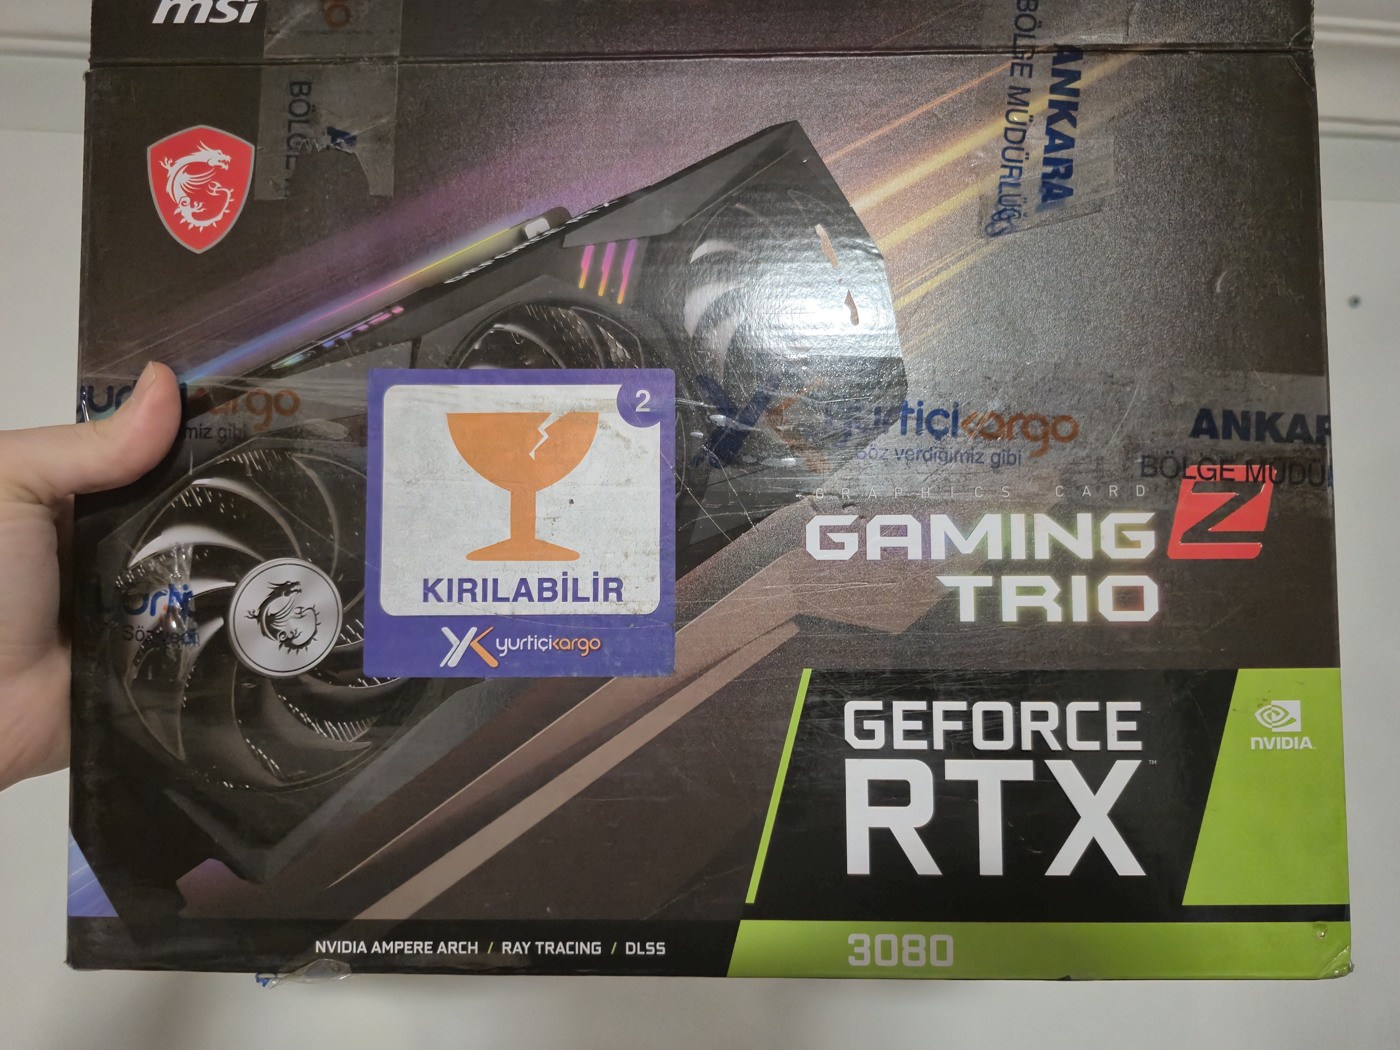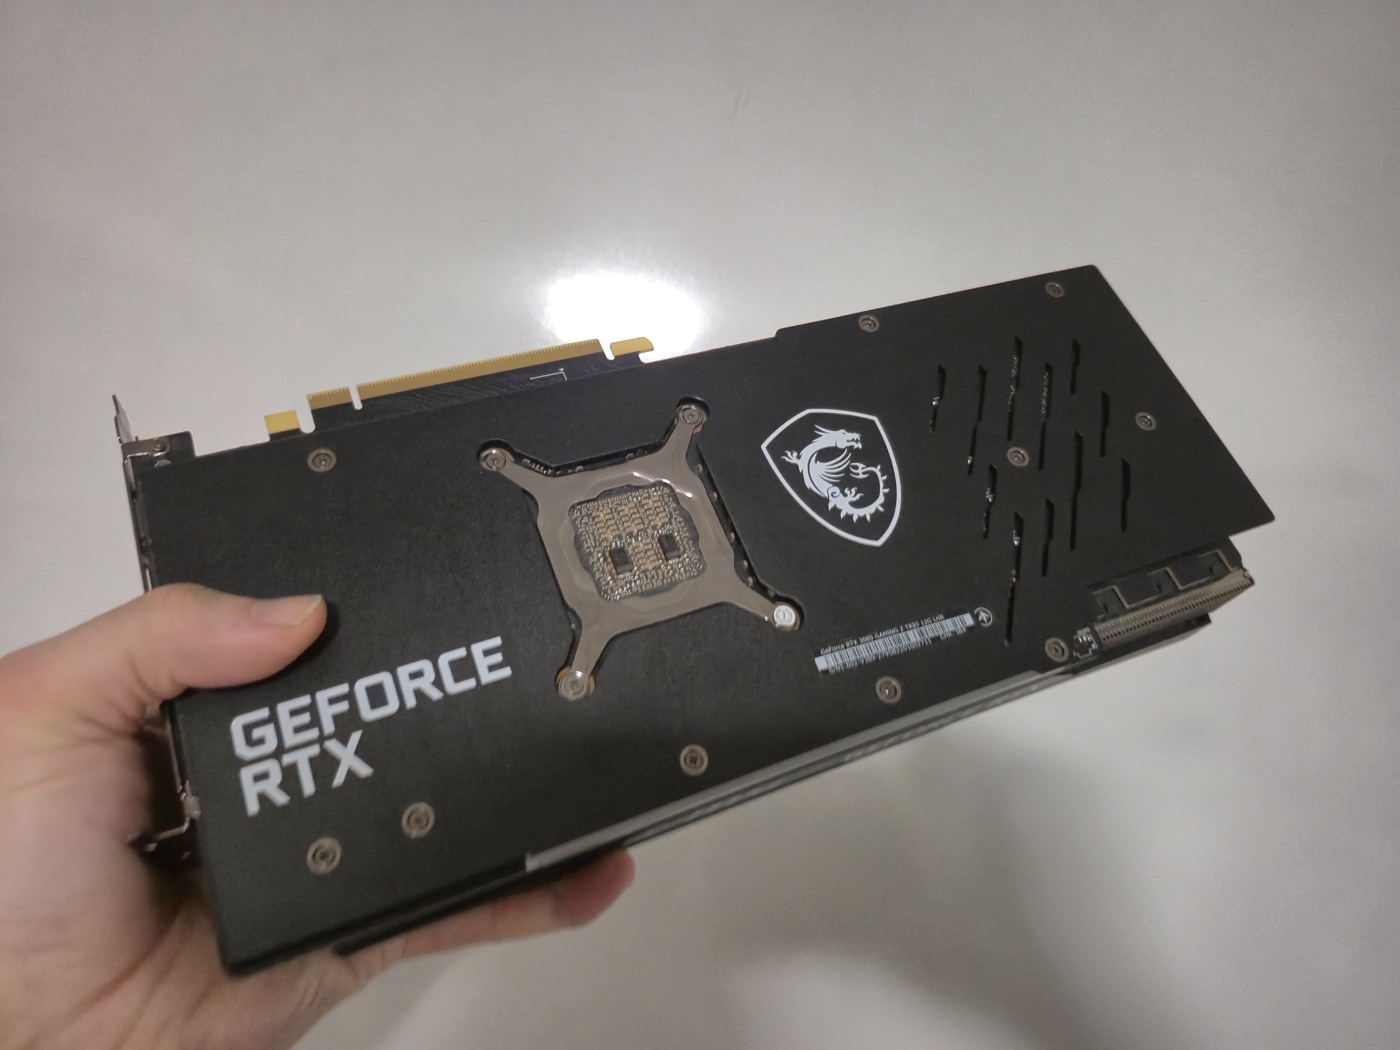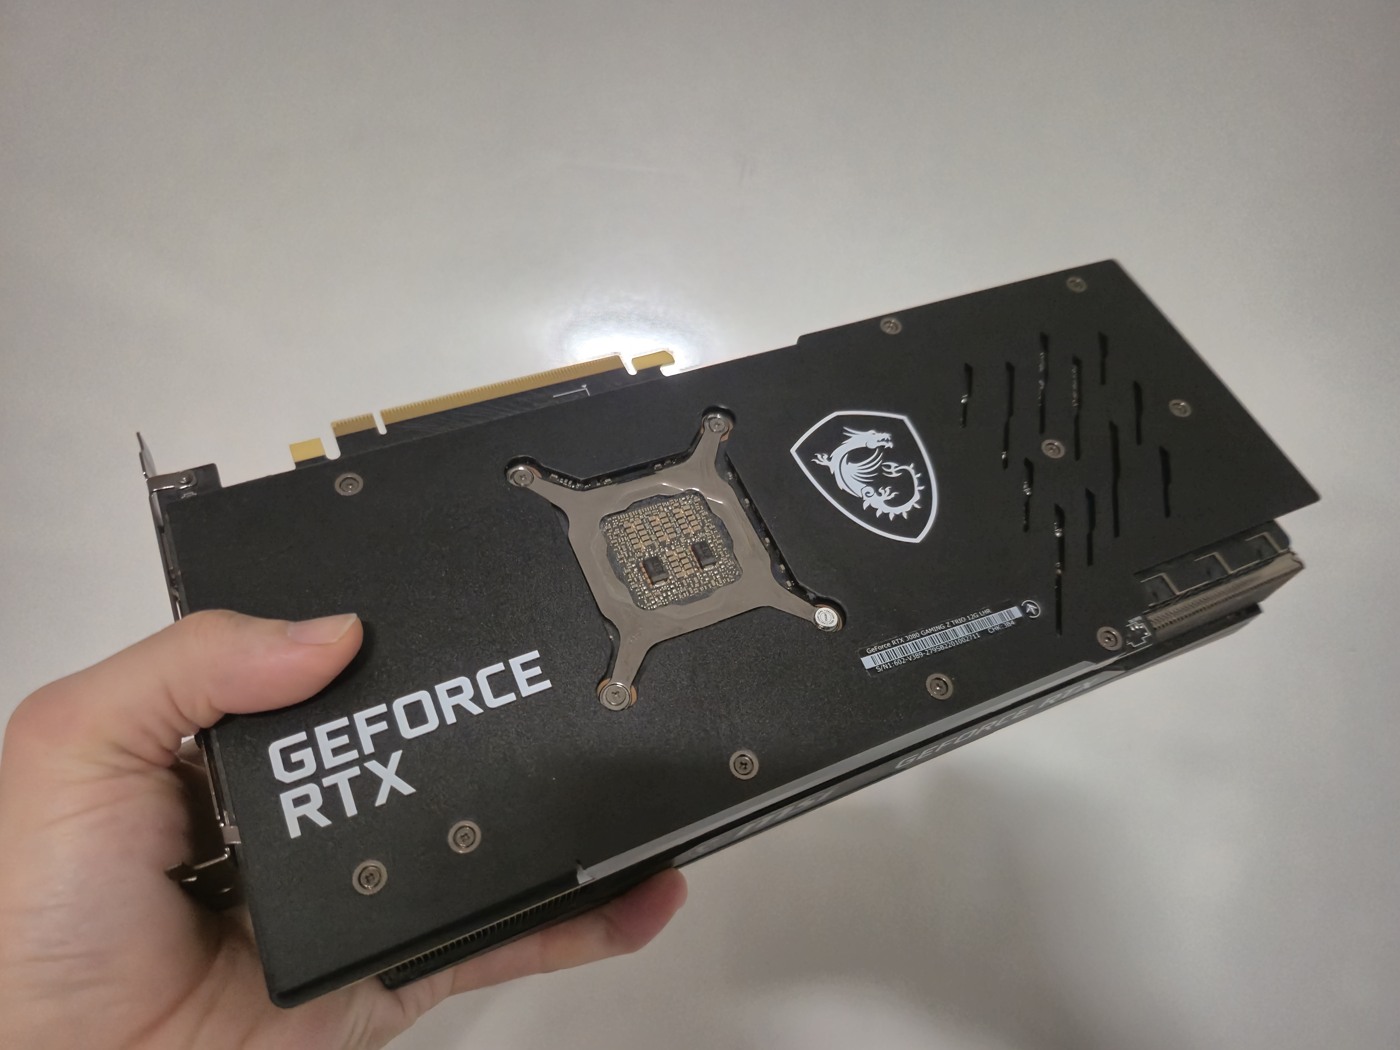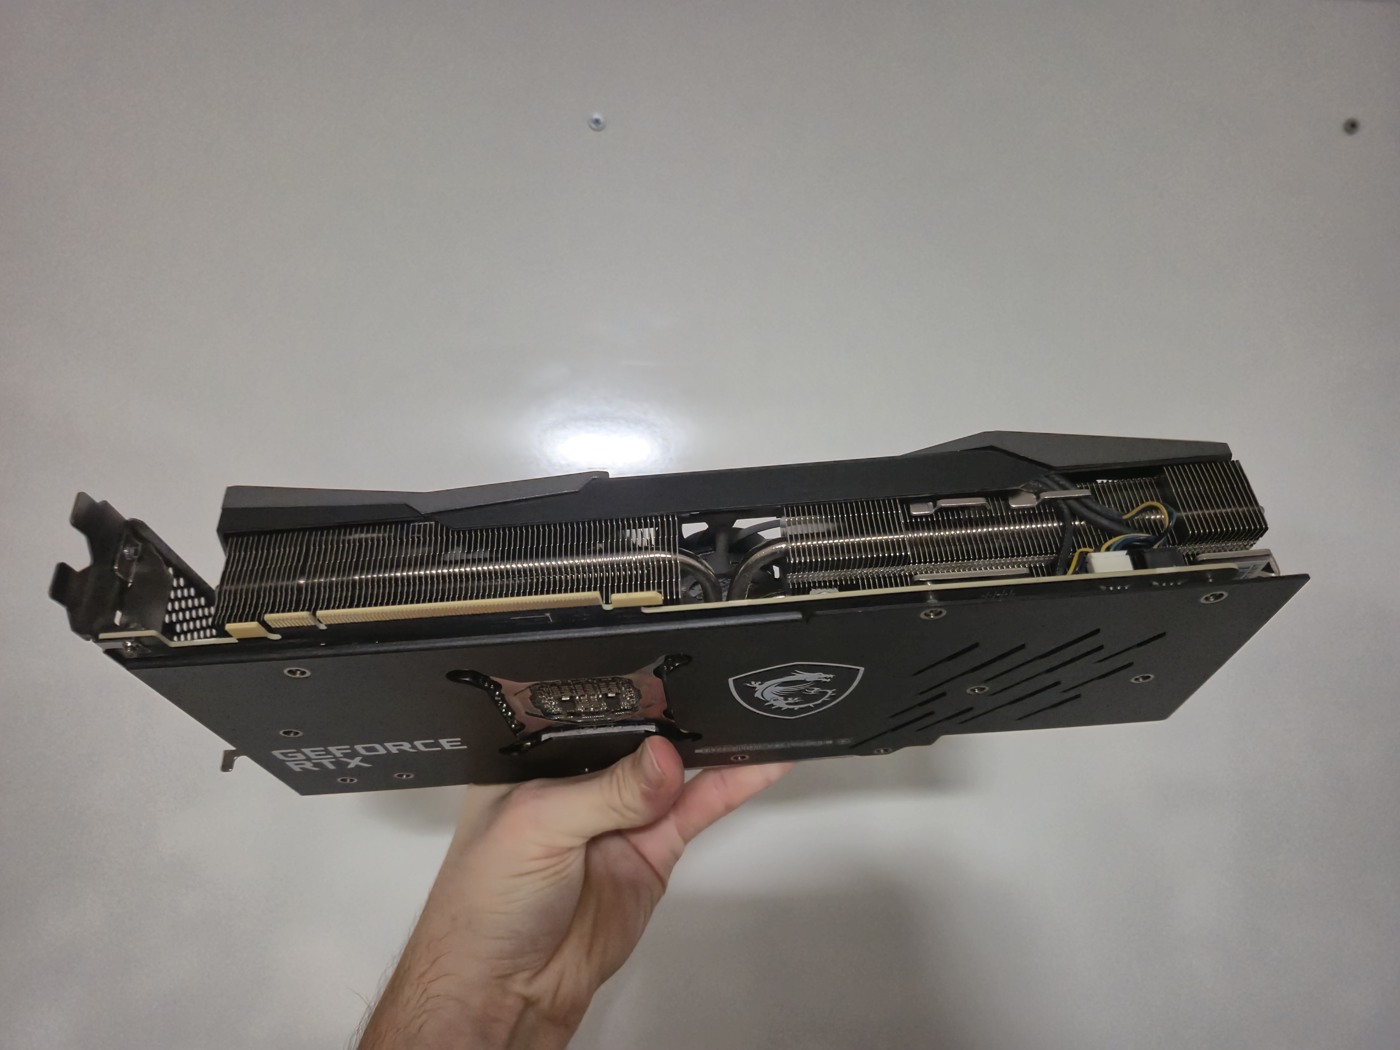
GPU test report

1440p GPU tests

Select a card to view its specifications, interactive test charts, photos, and test videos.

6 tested cards1 reference card · not for sale2560 × 144019 November 2026 · UTC+03

Türkçe

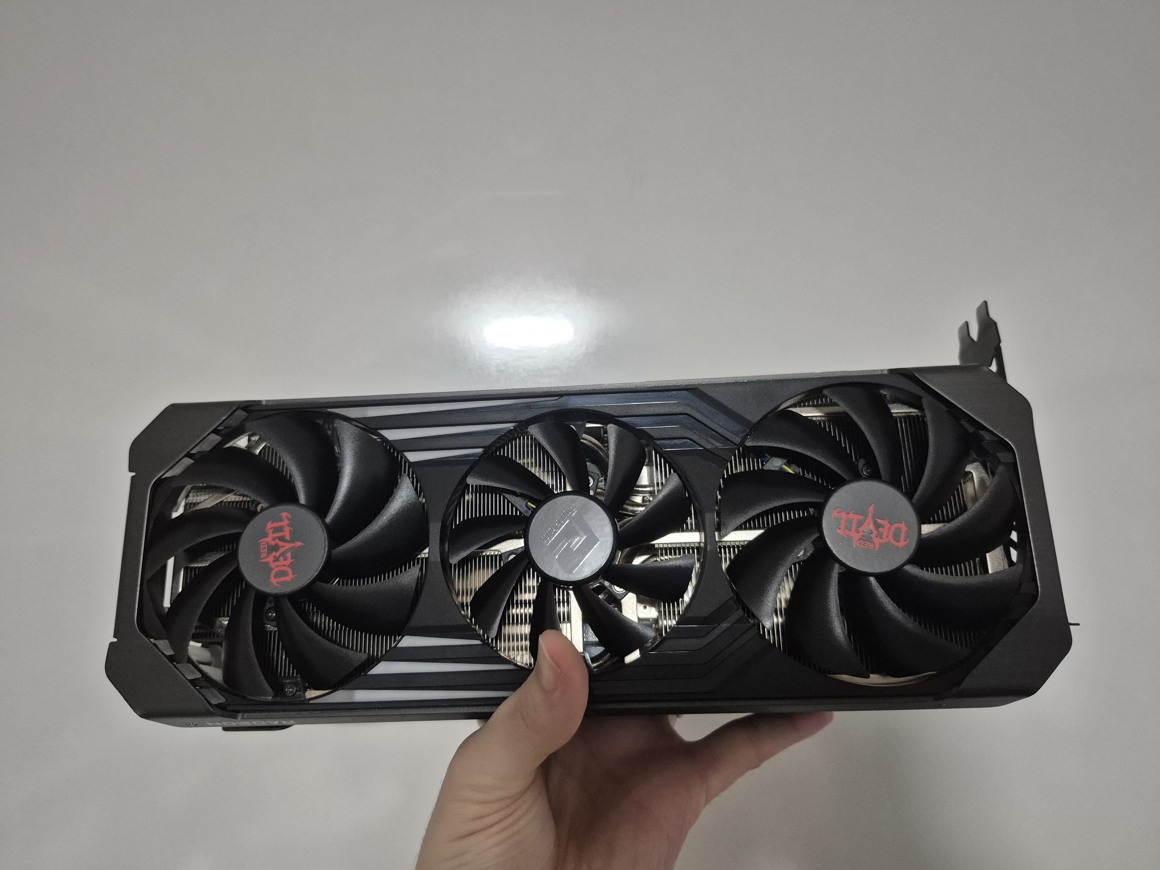
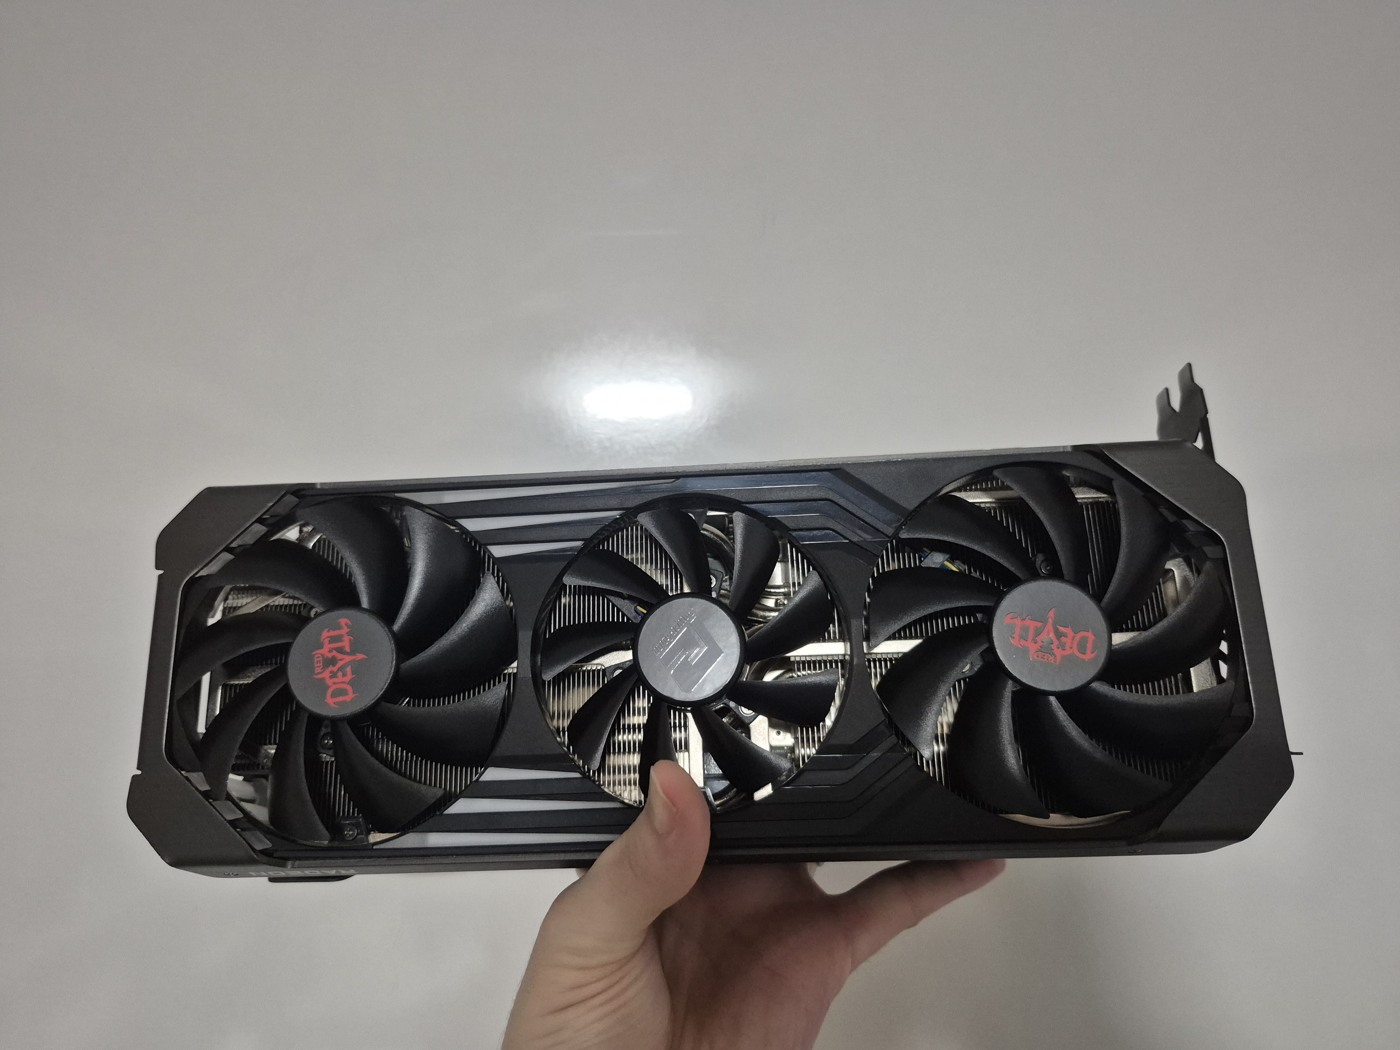
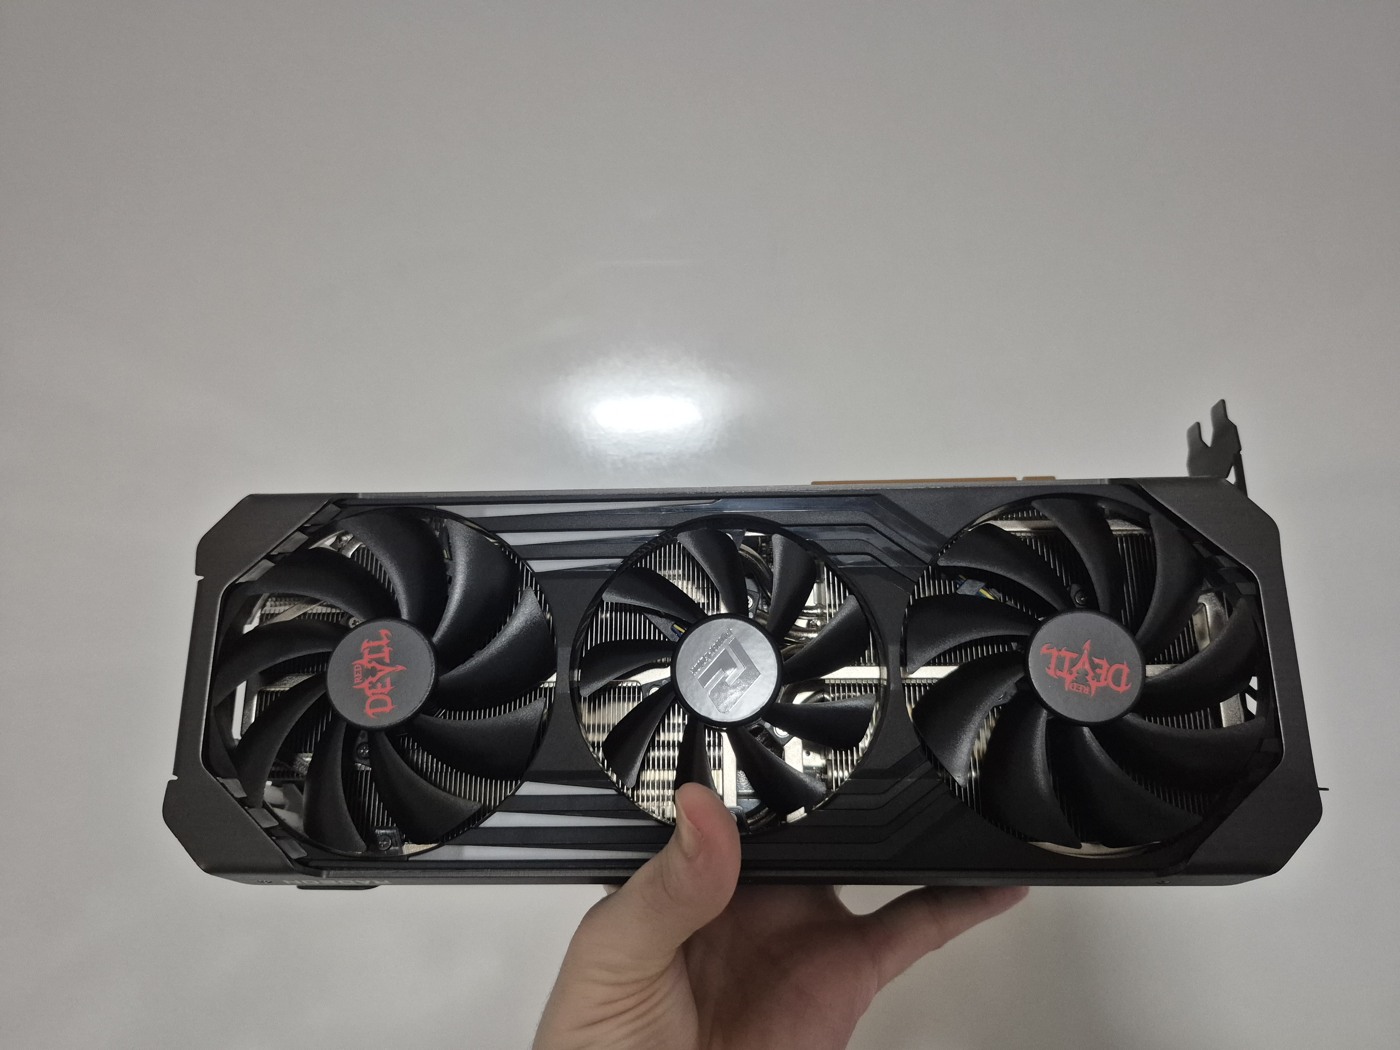
Tested physical card

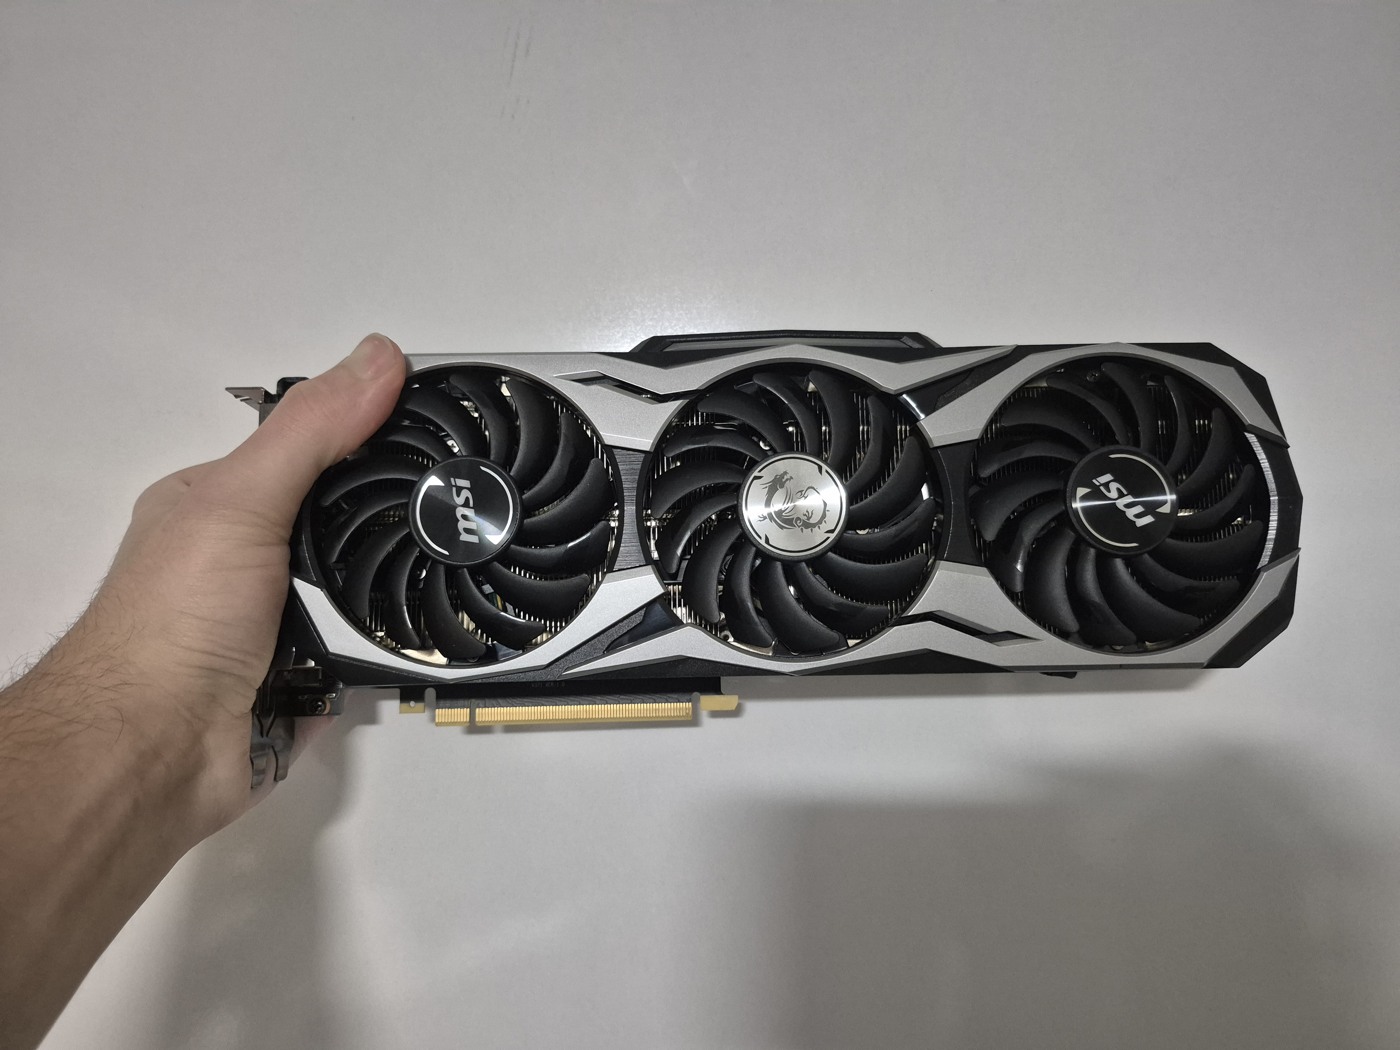
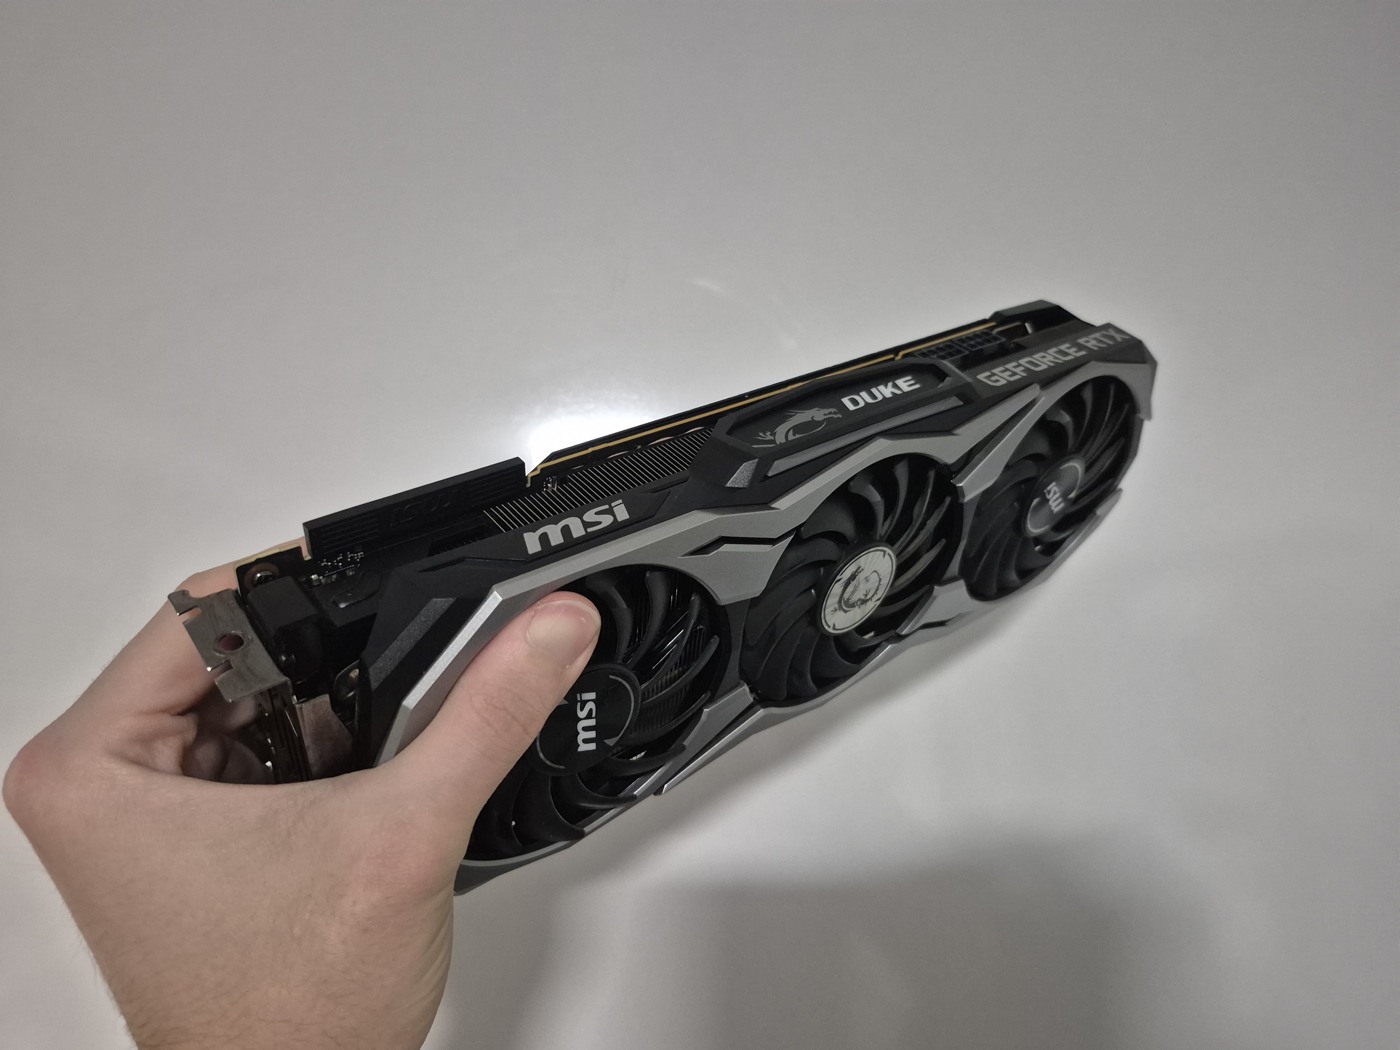
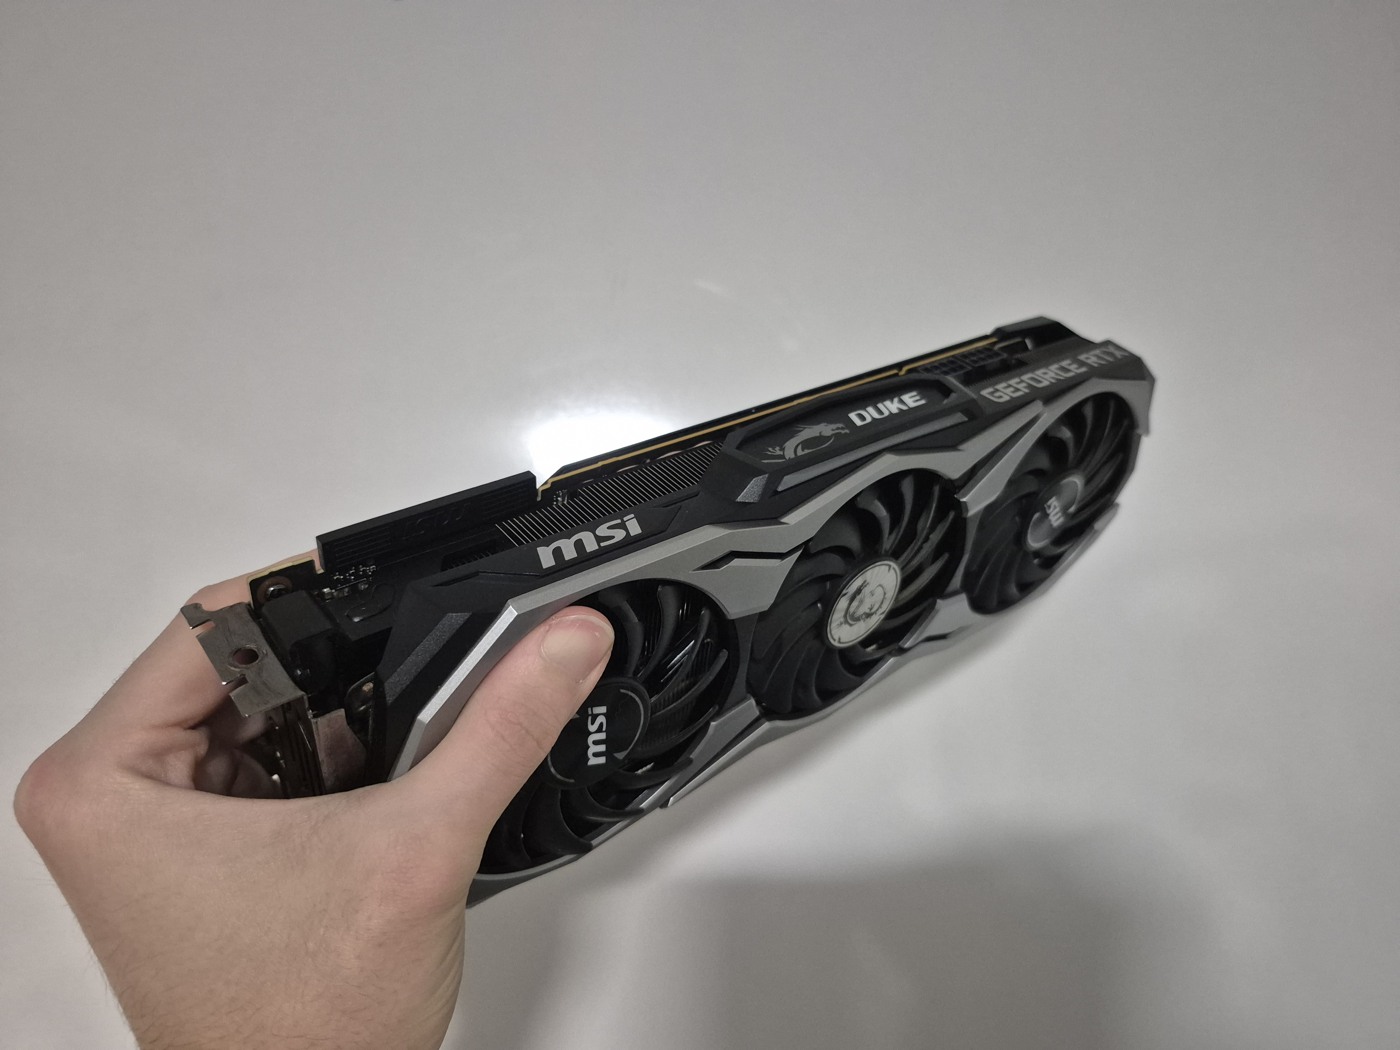
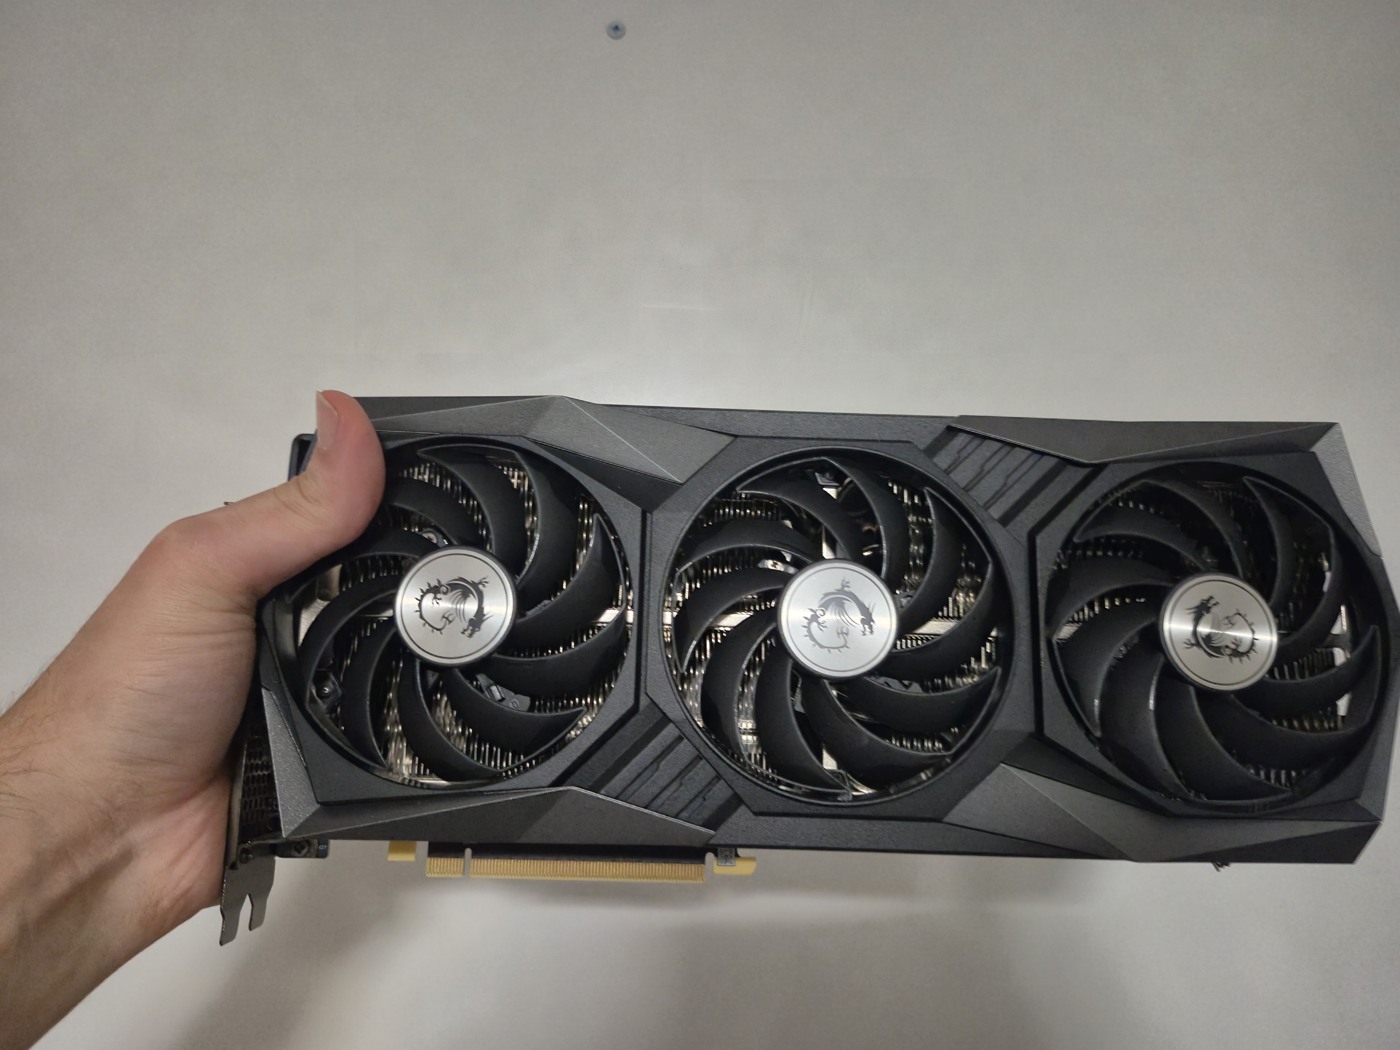
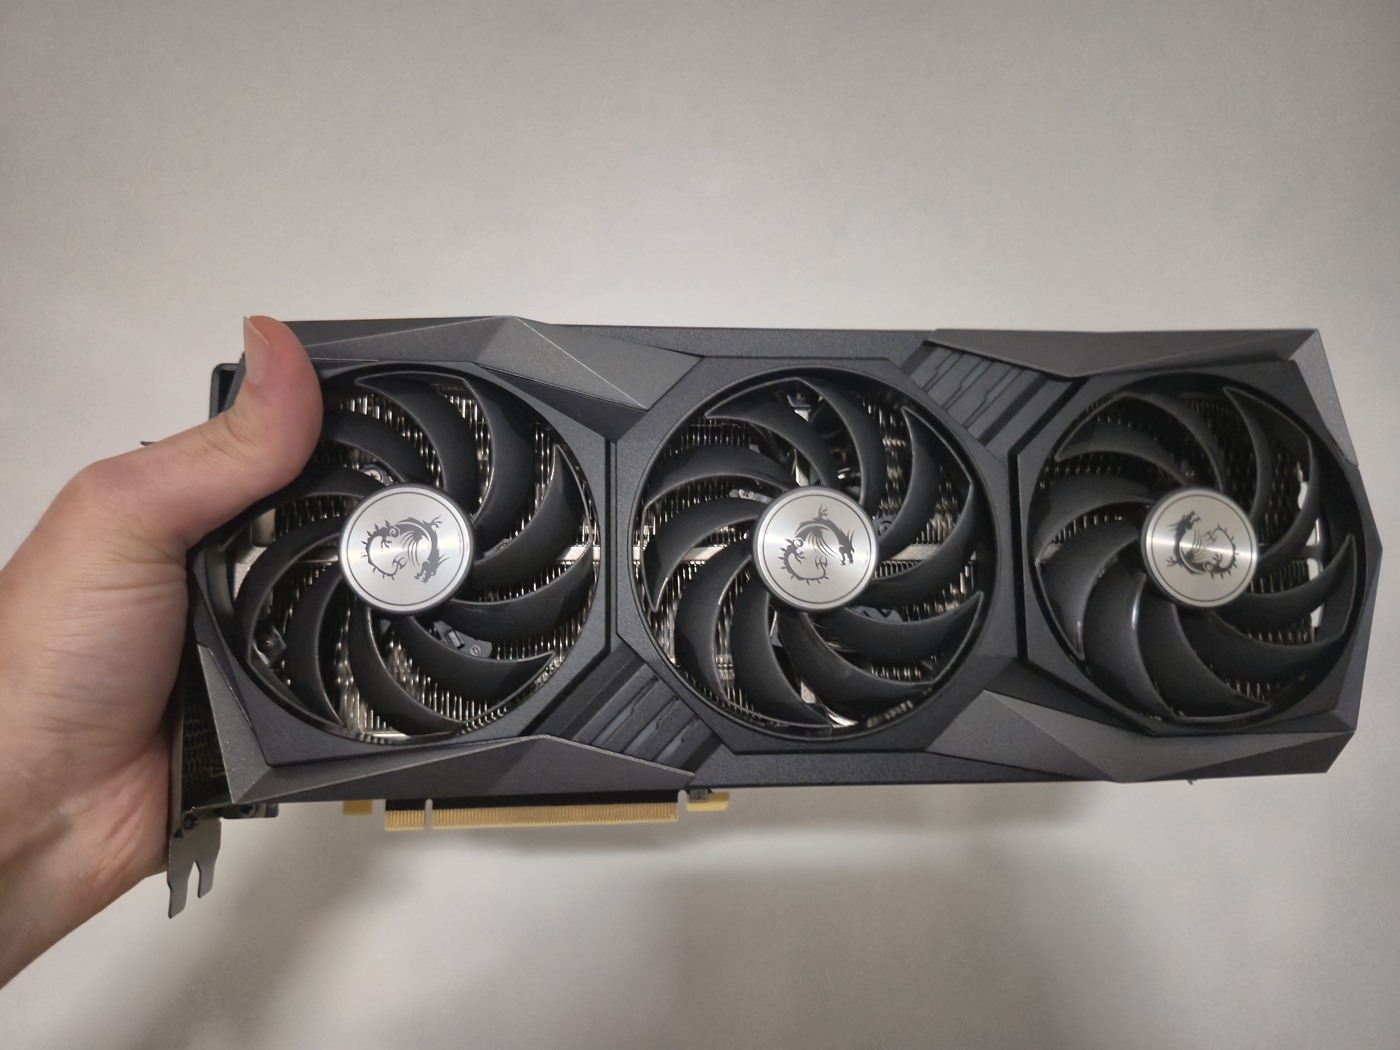
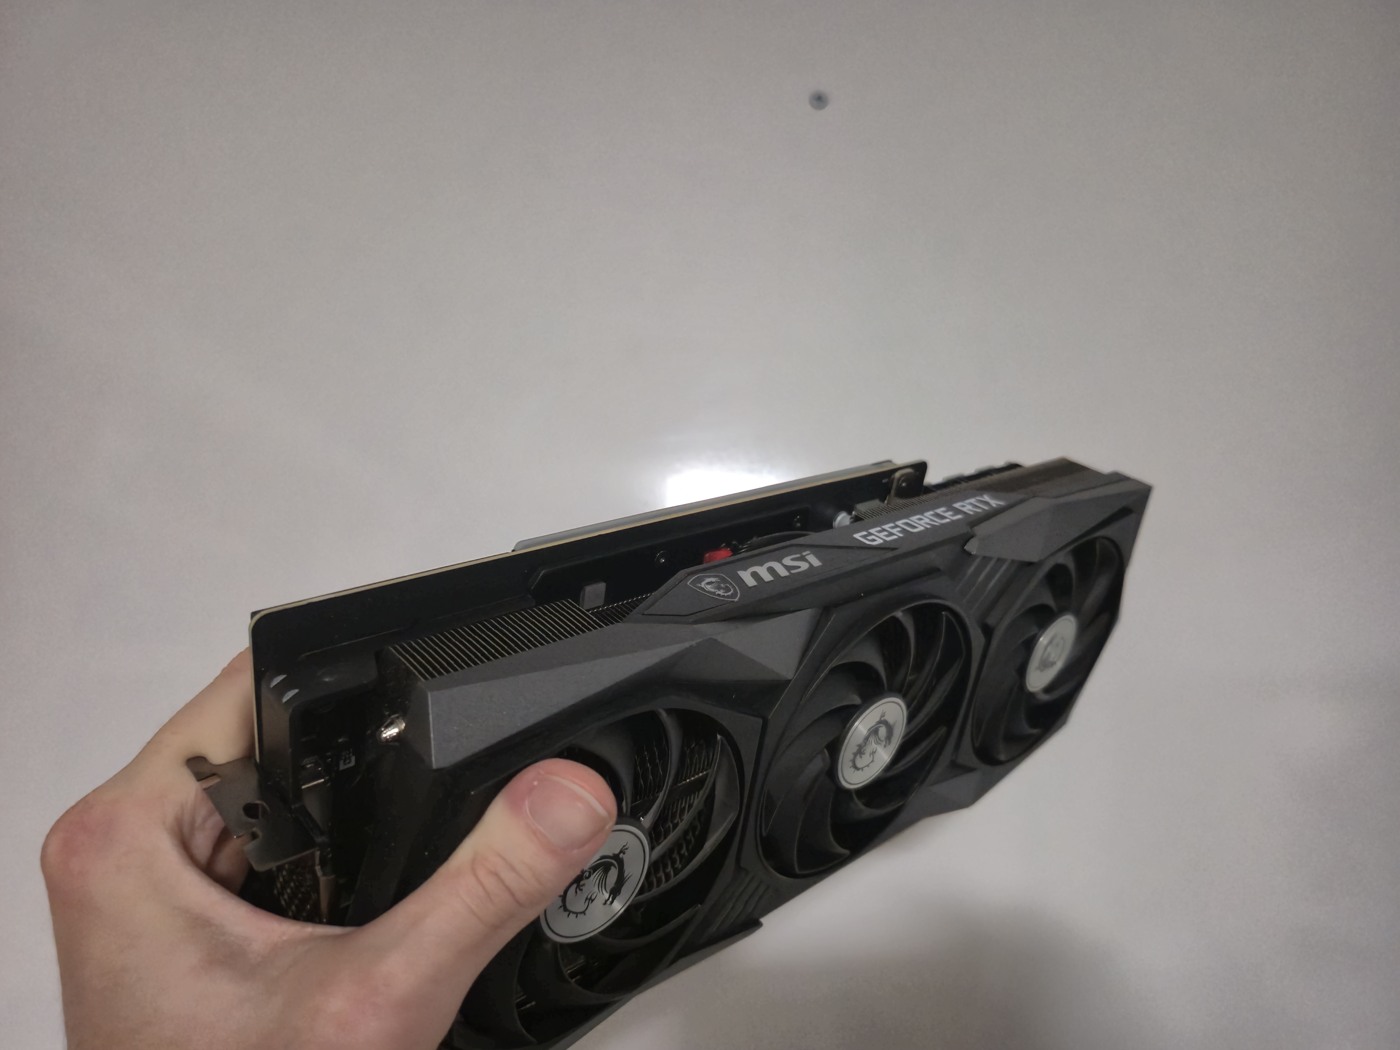
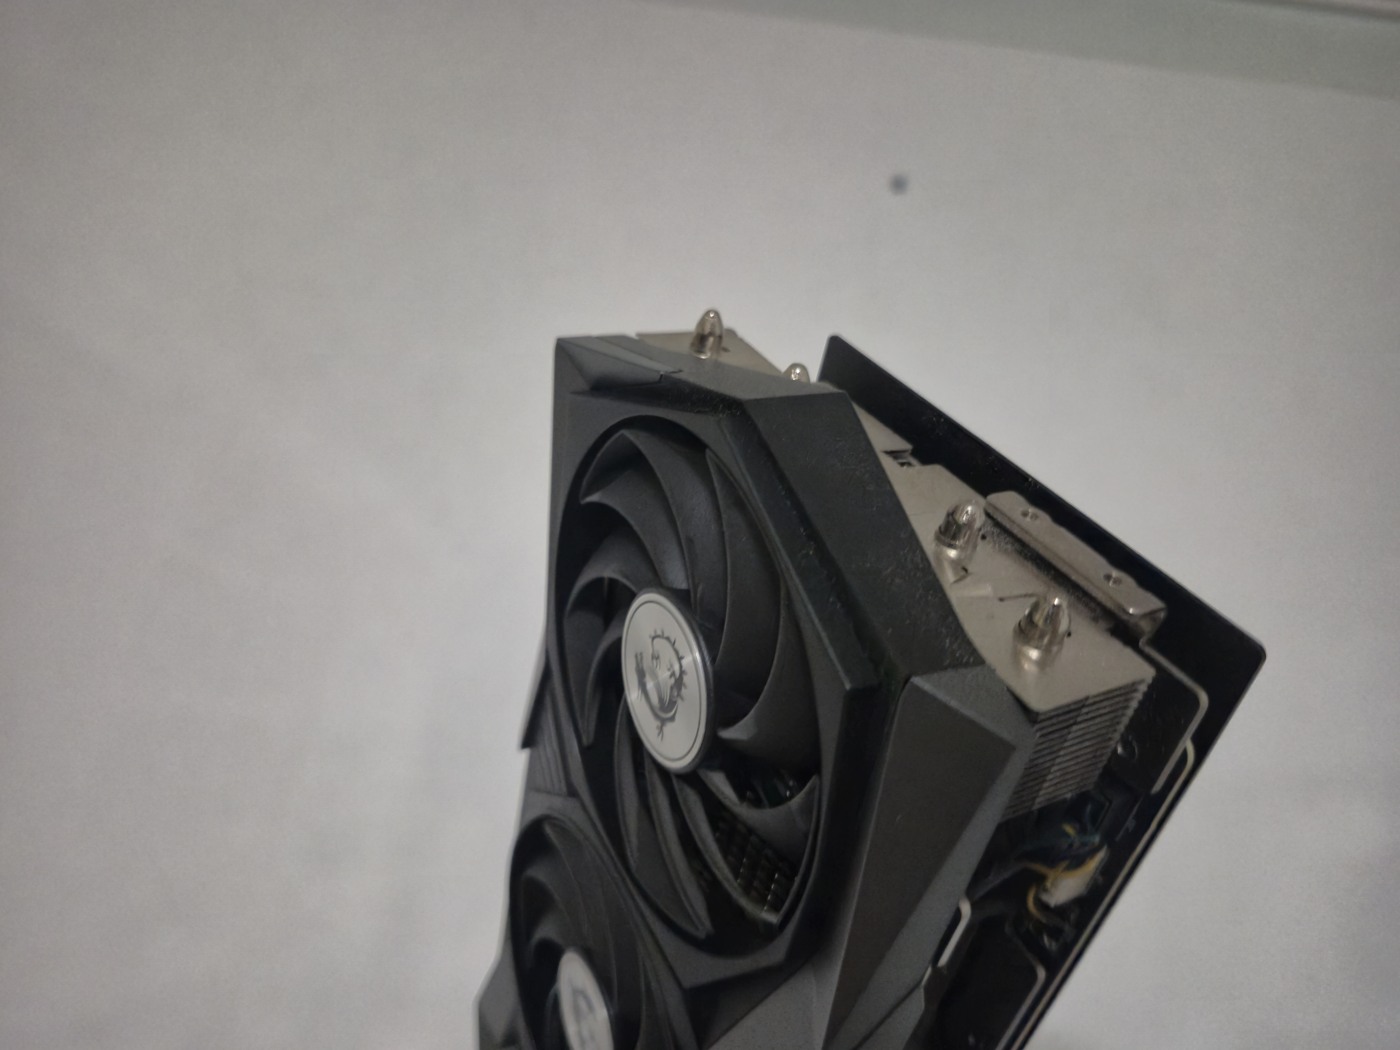
MSI RTX 2080 Ti DUKE 11G OC

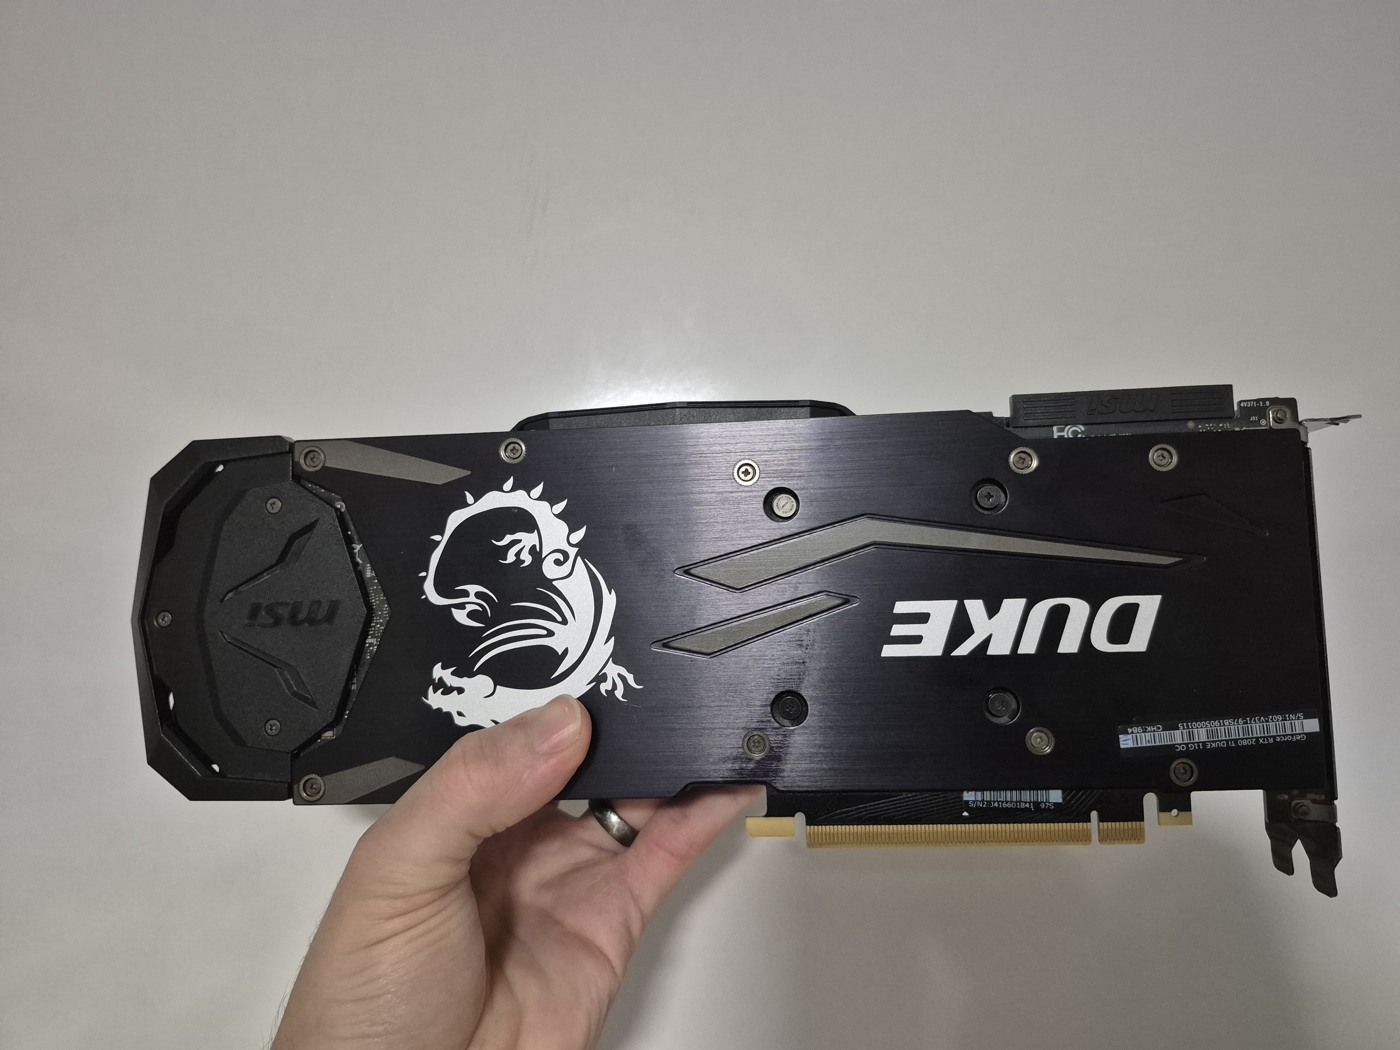
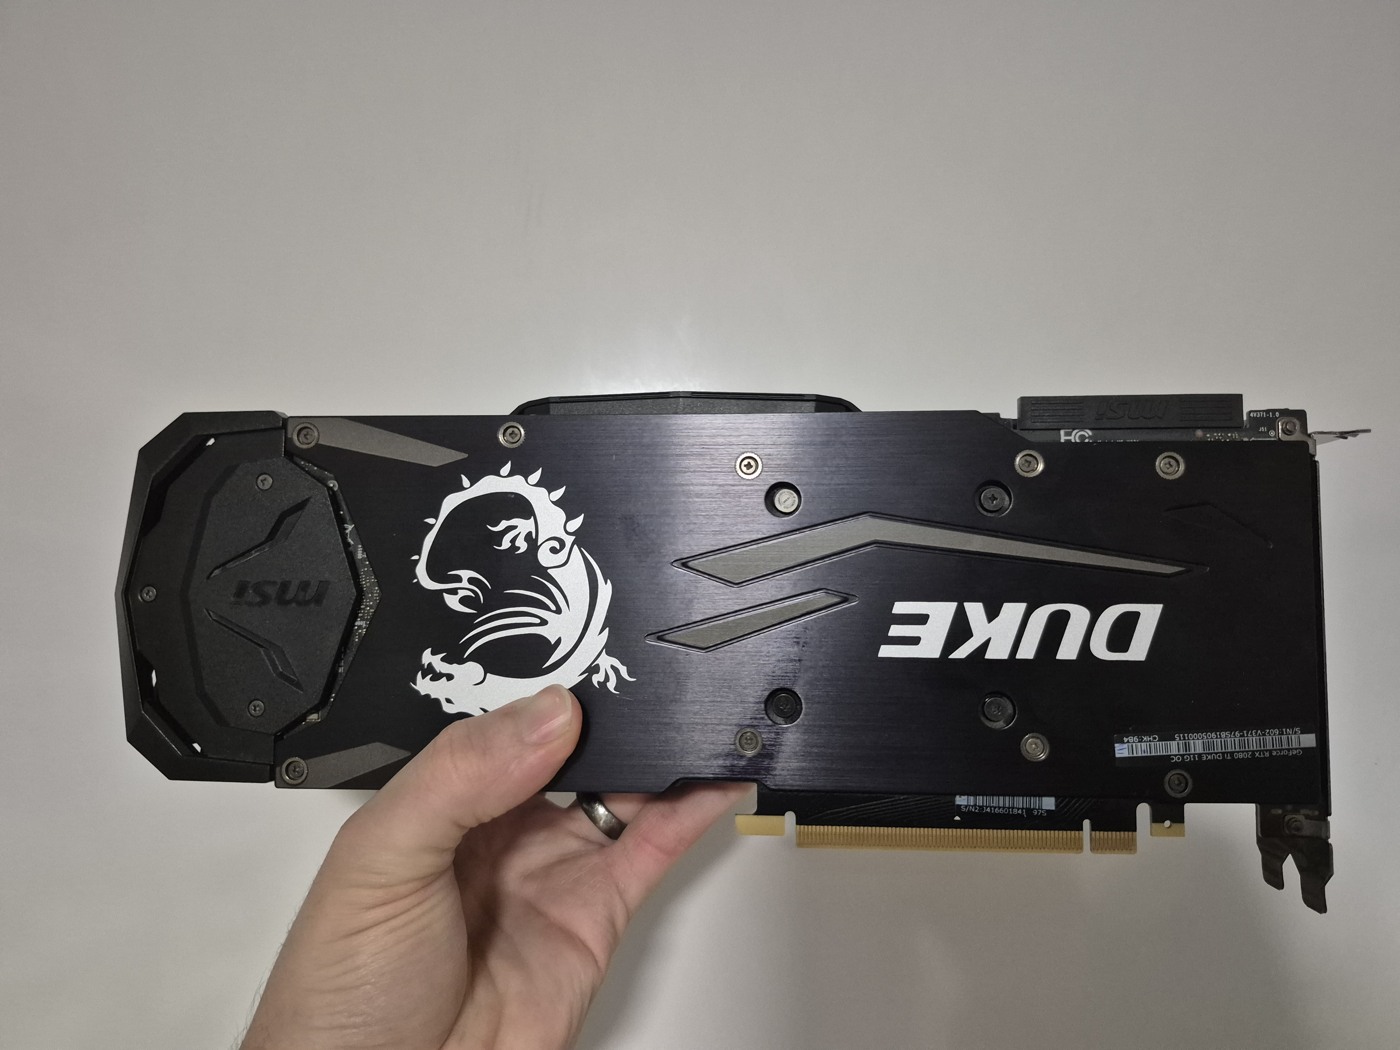
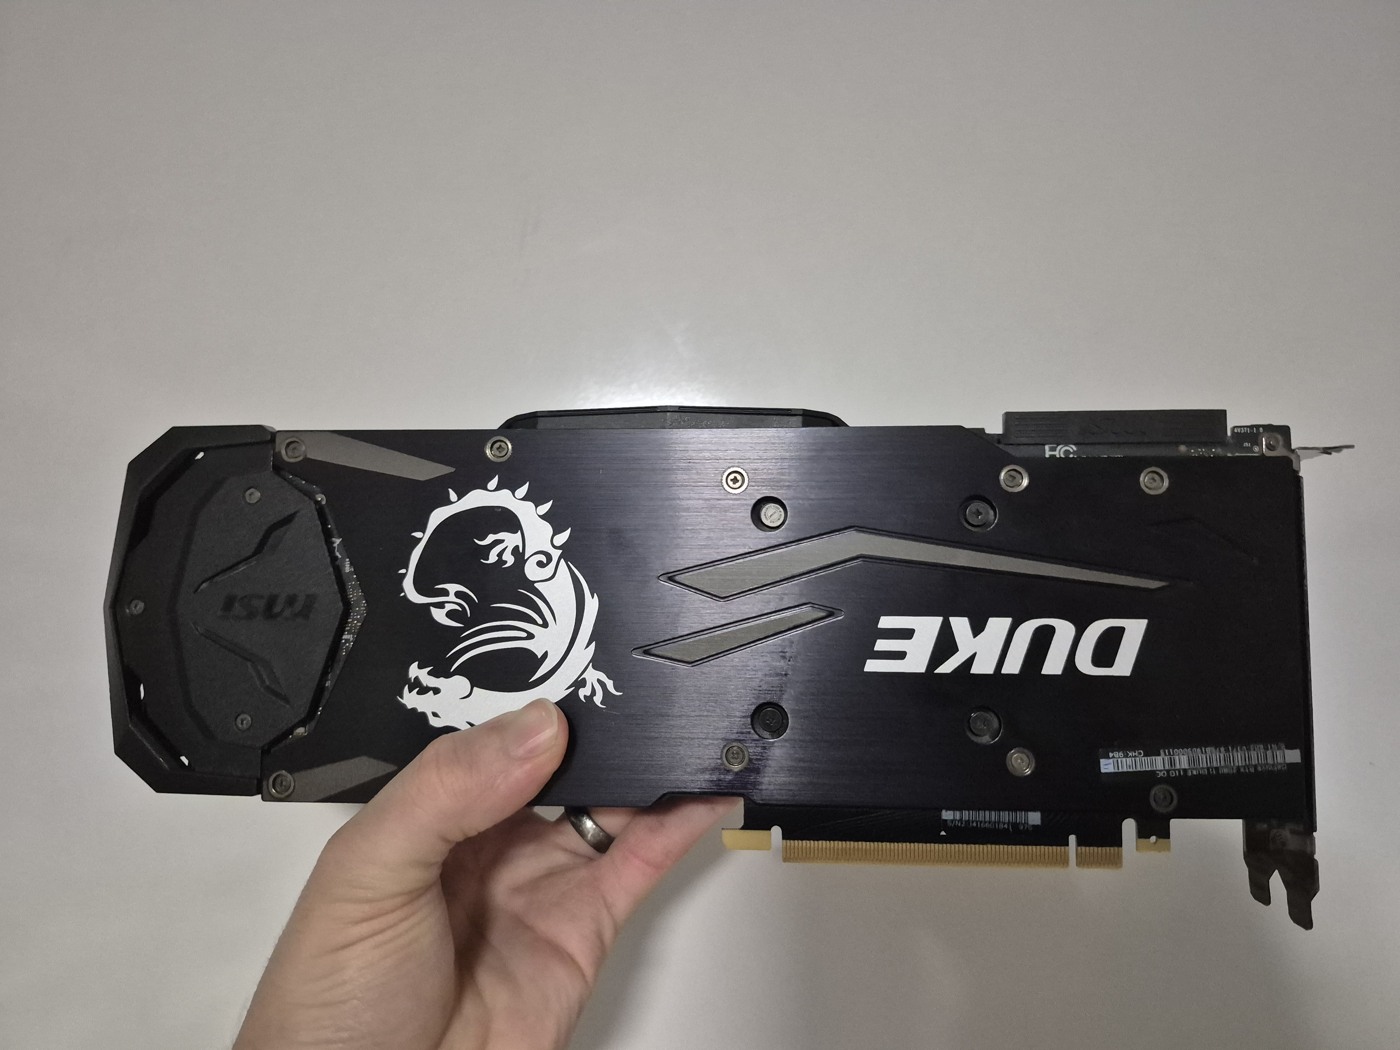
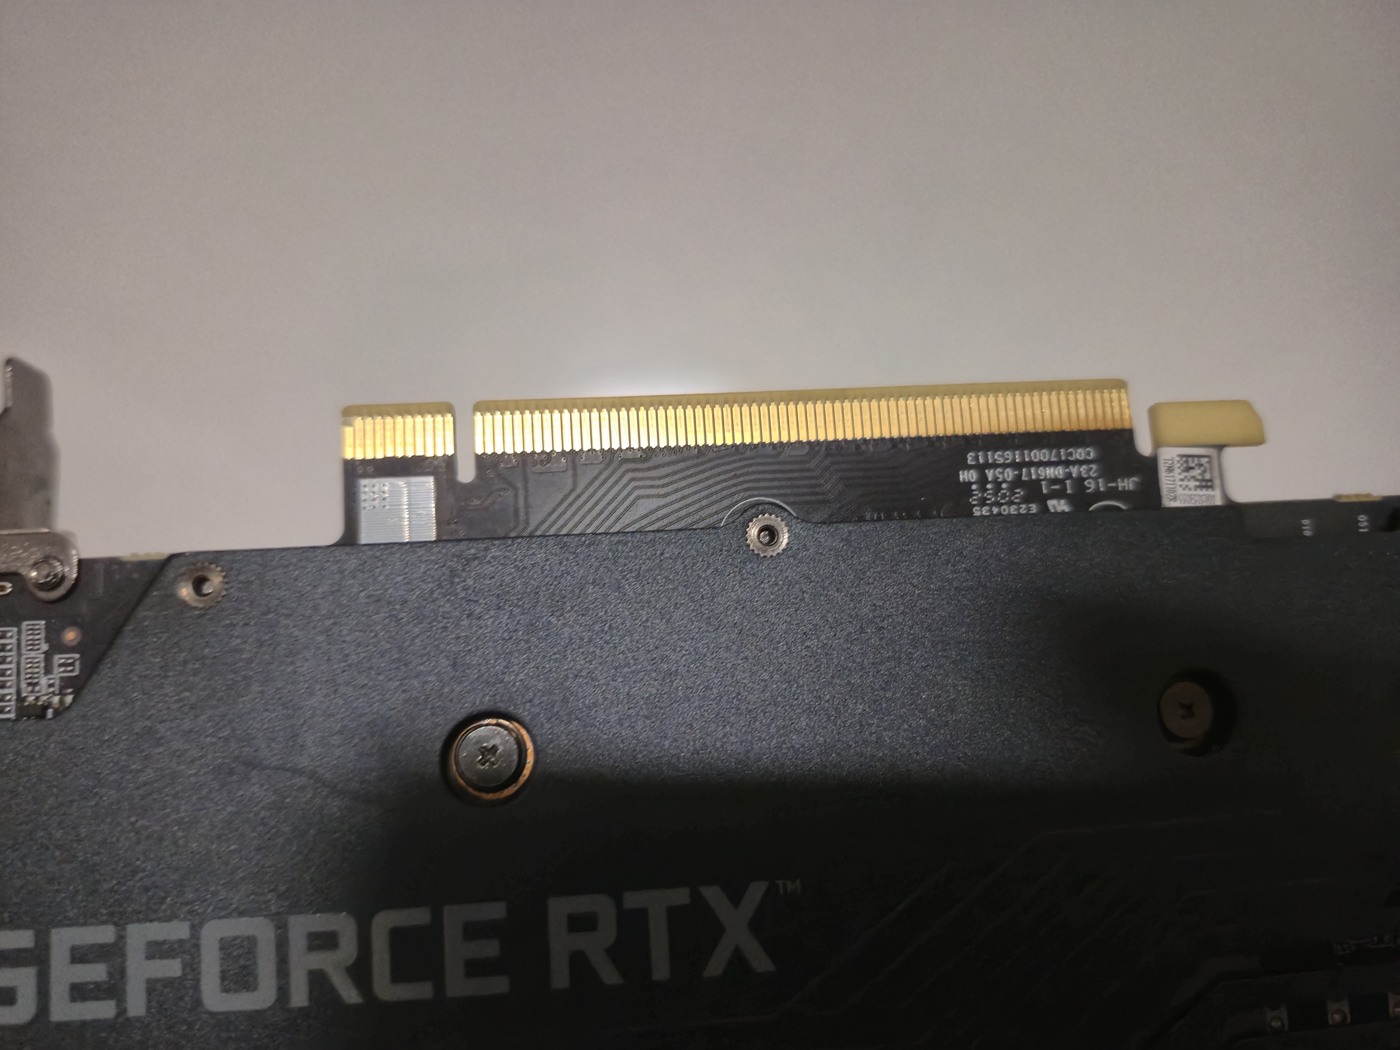
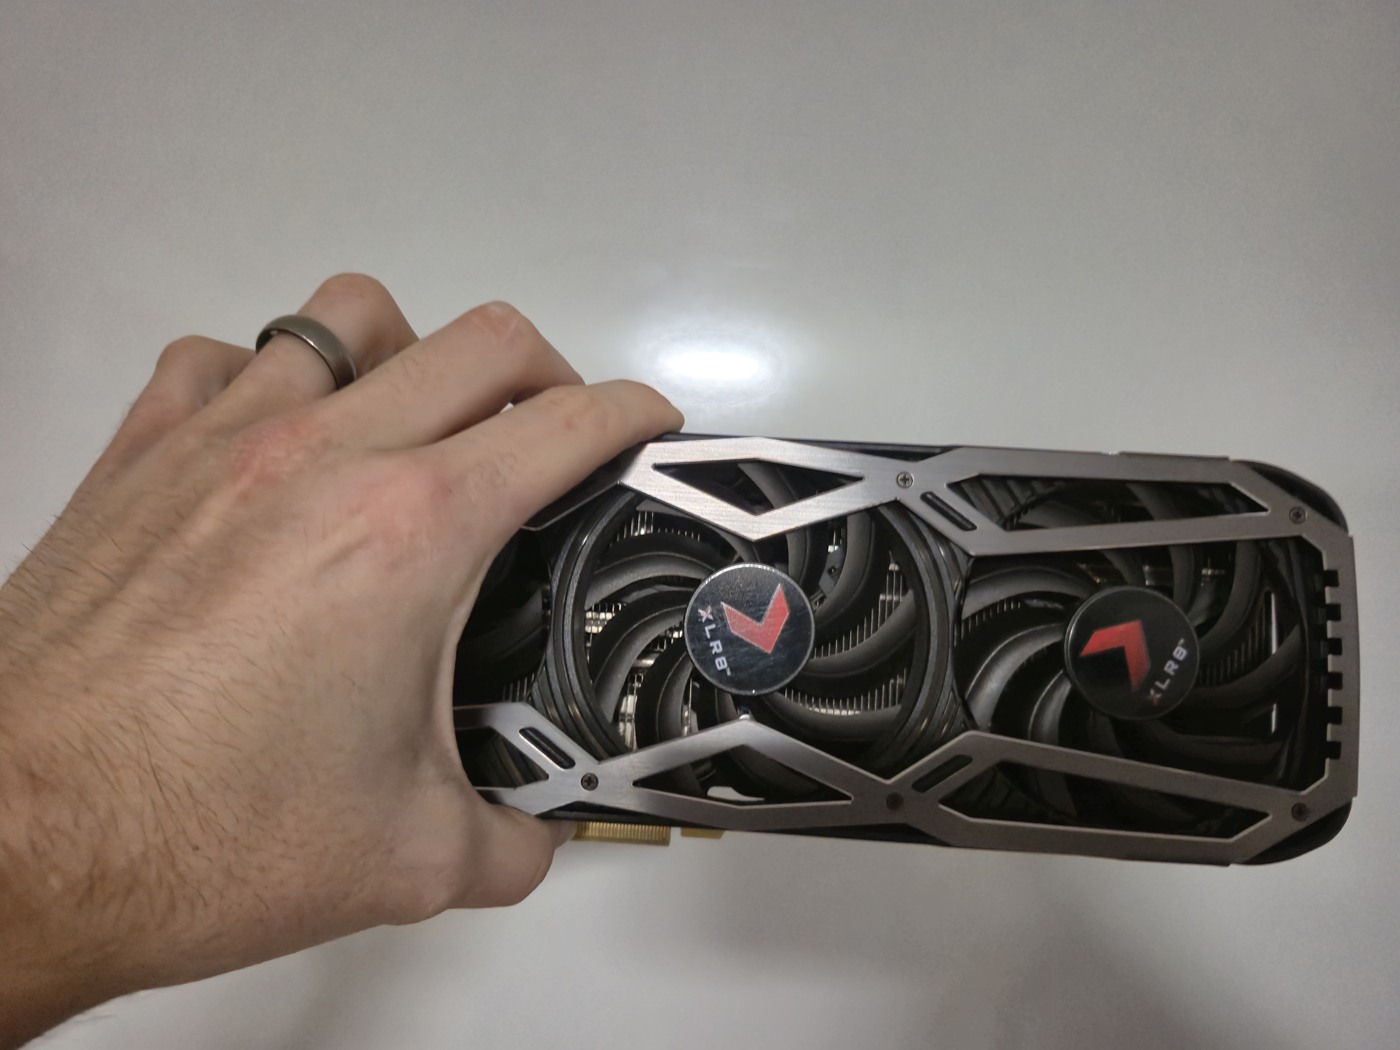
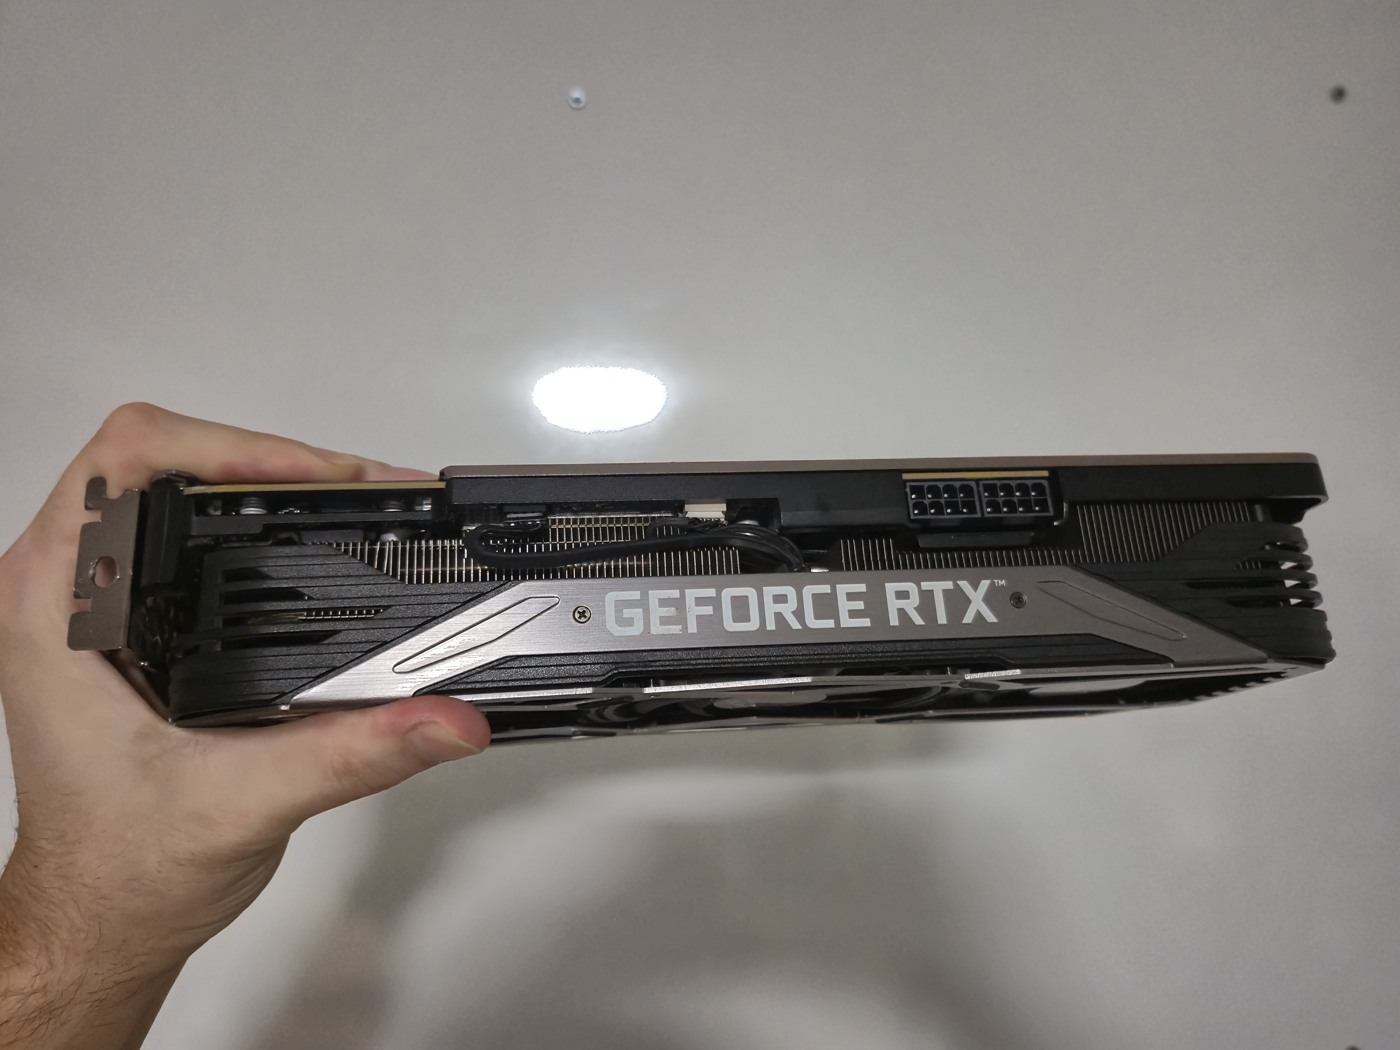
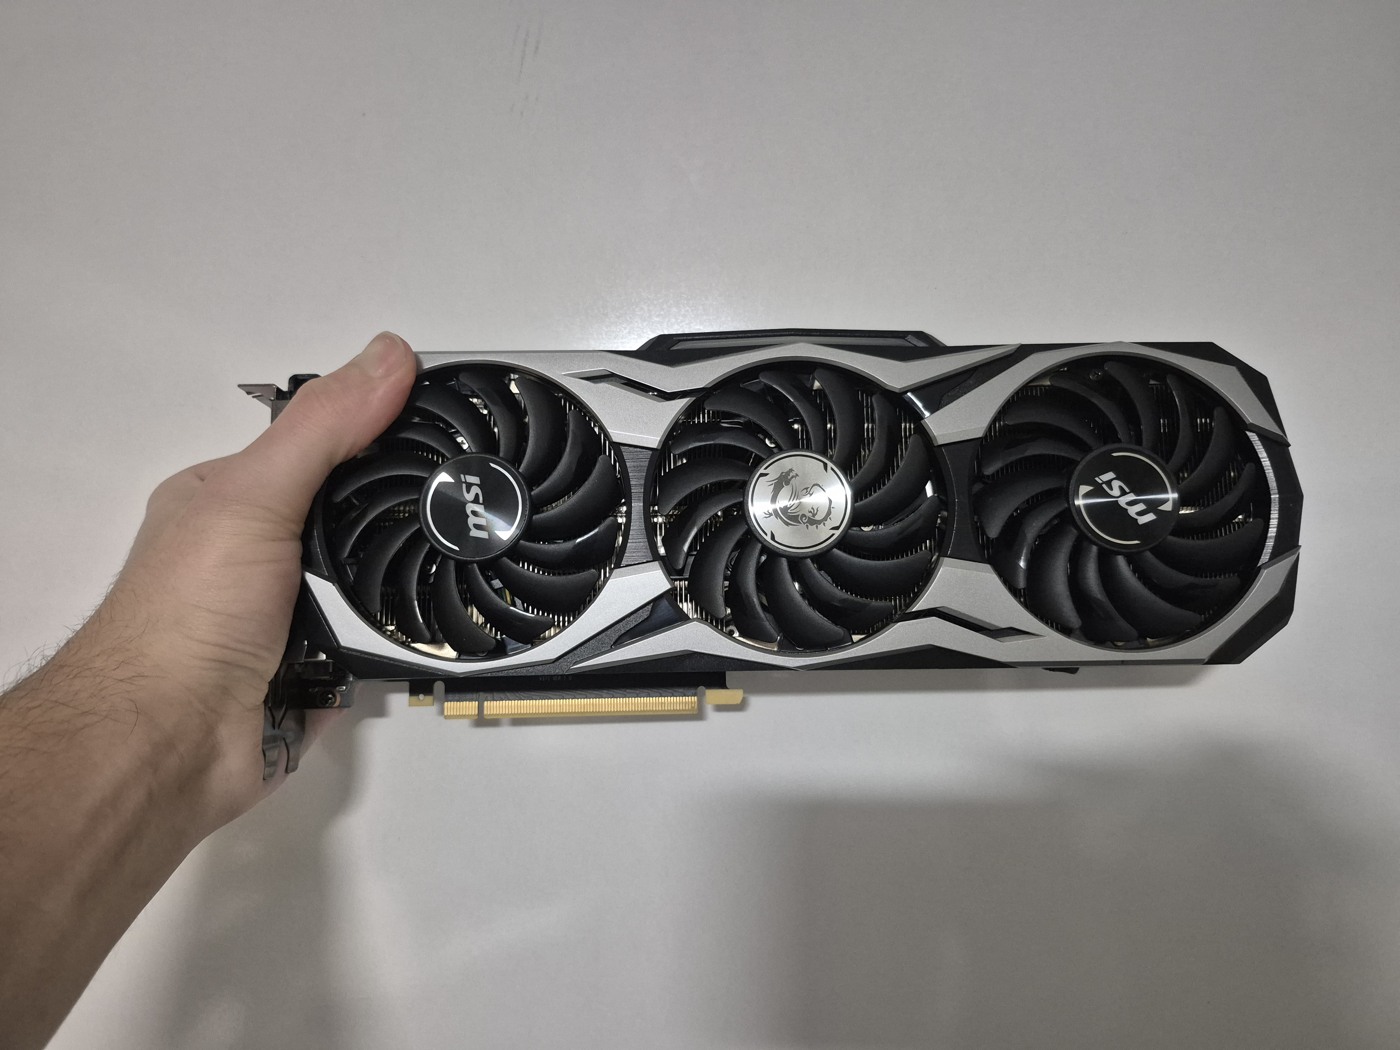
The card label confirms the DUKE 11G OC model.

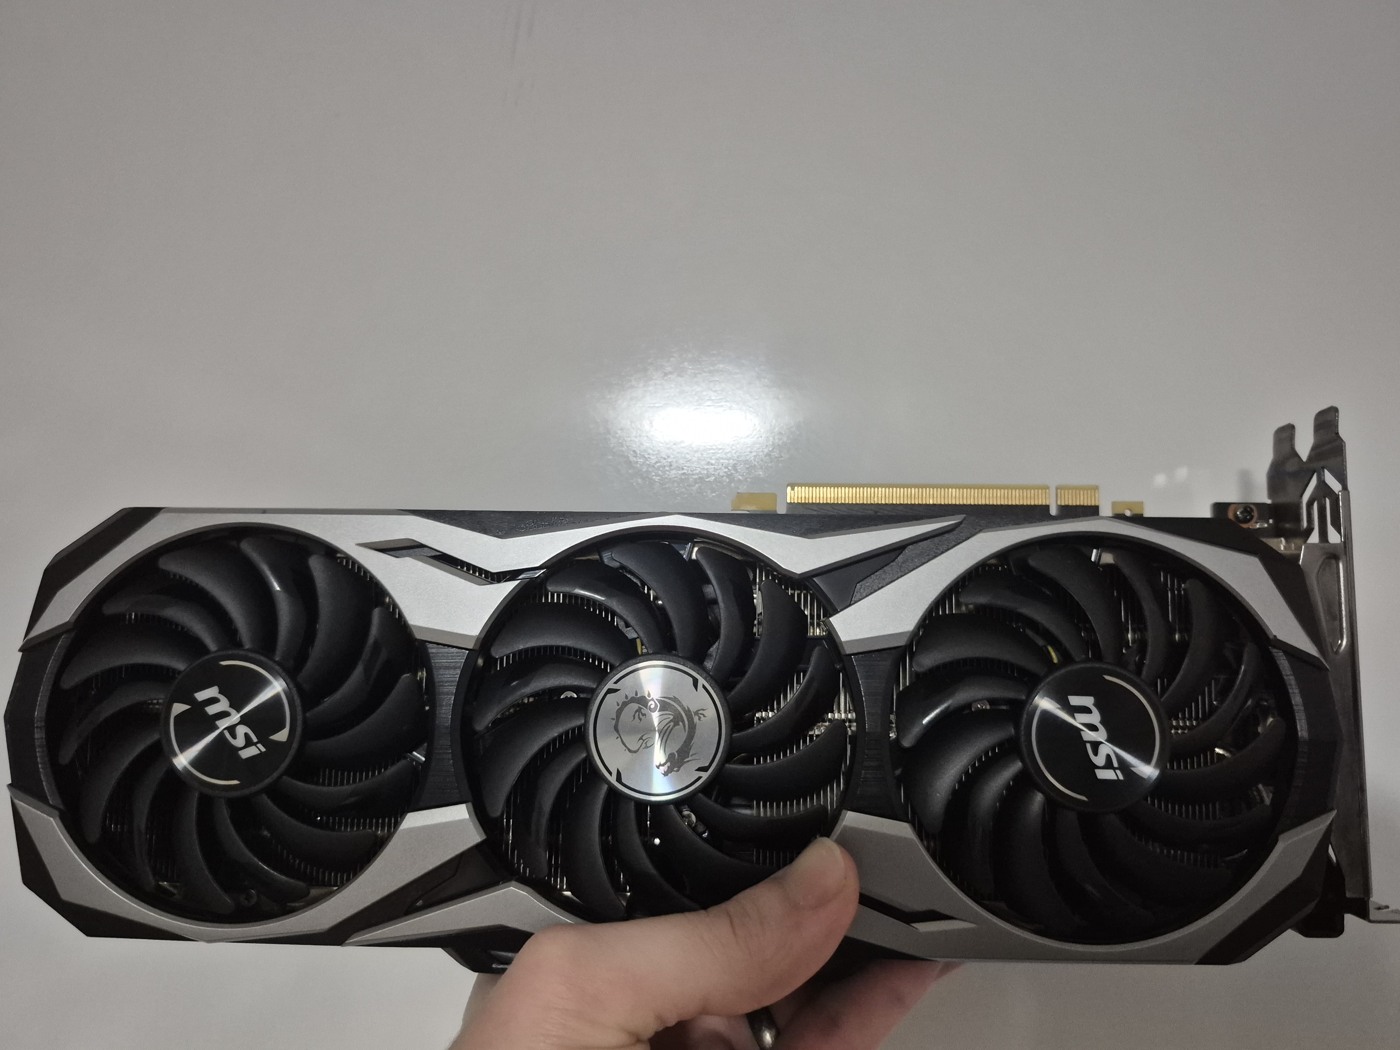
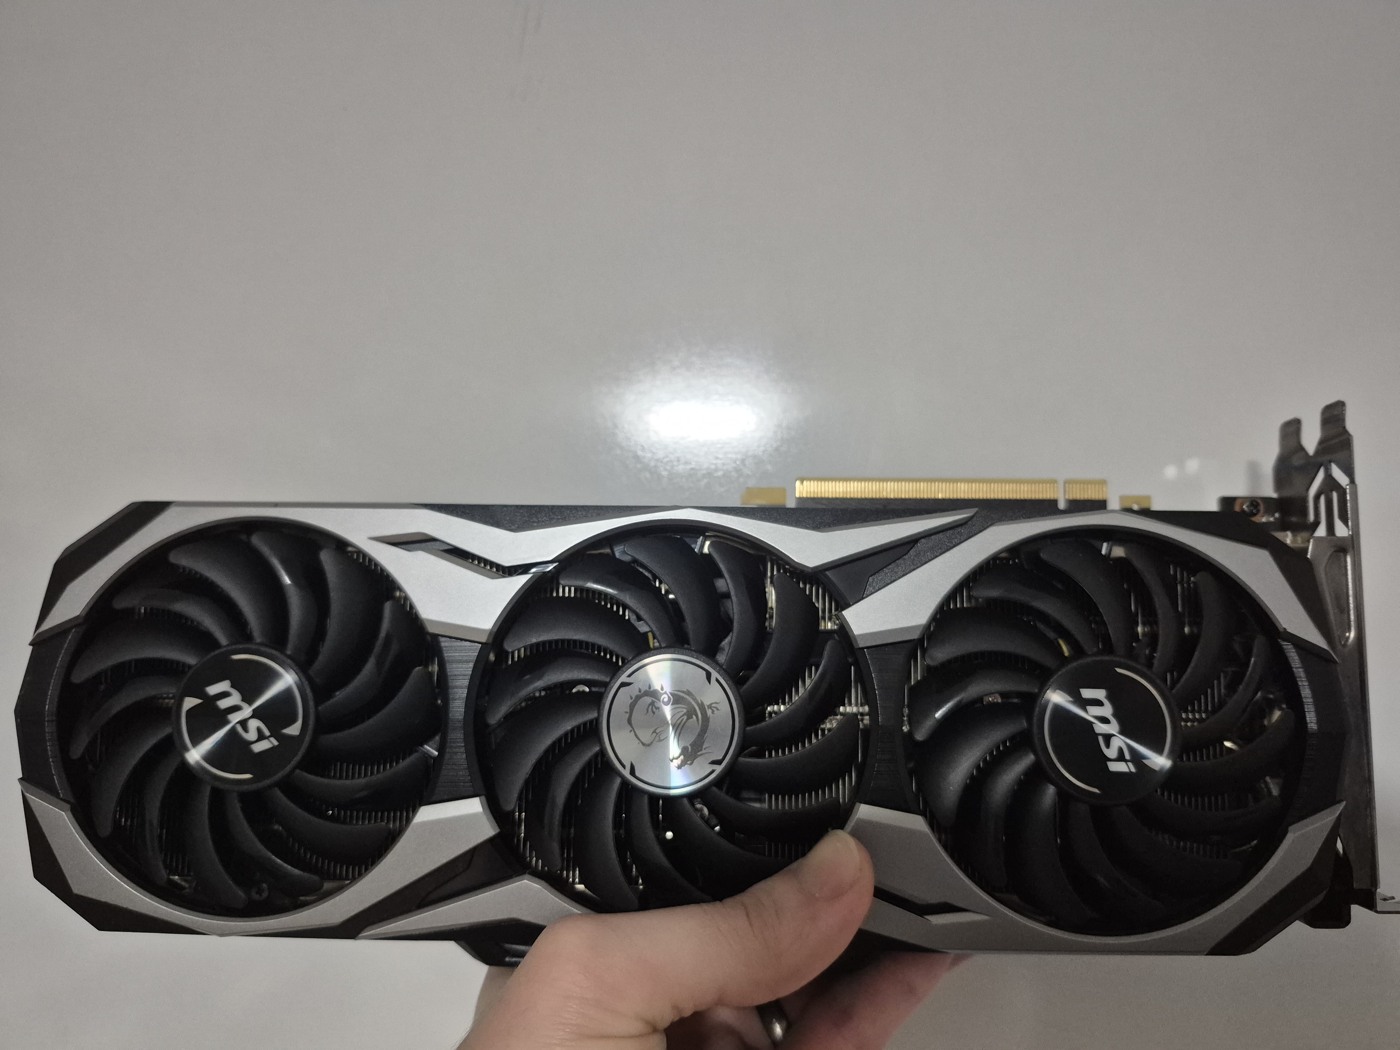
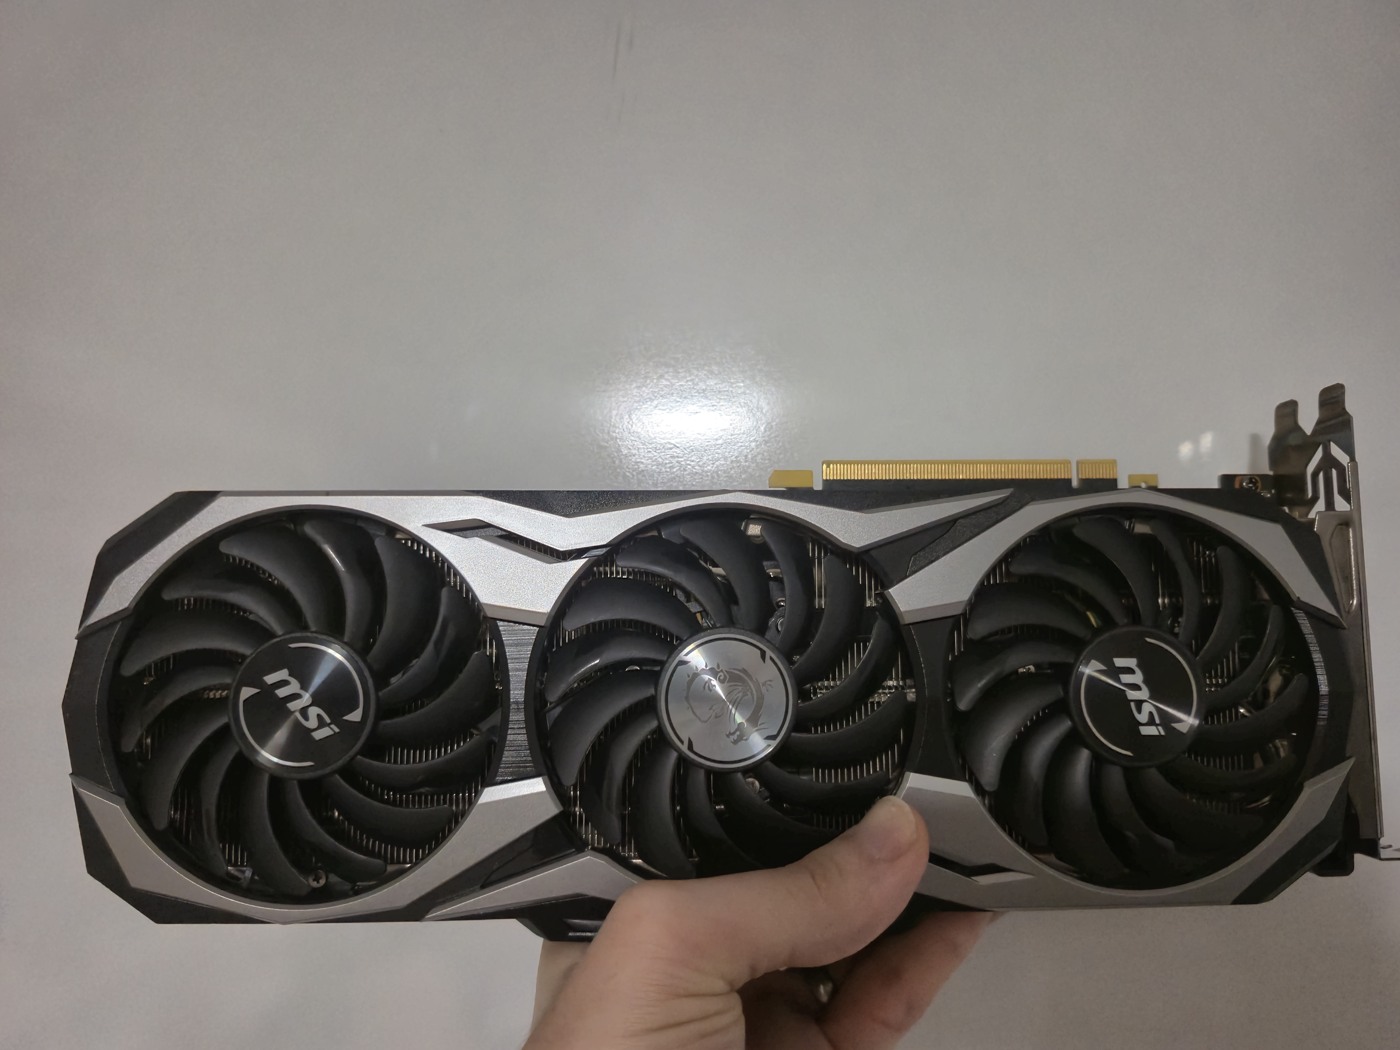
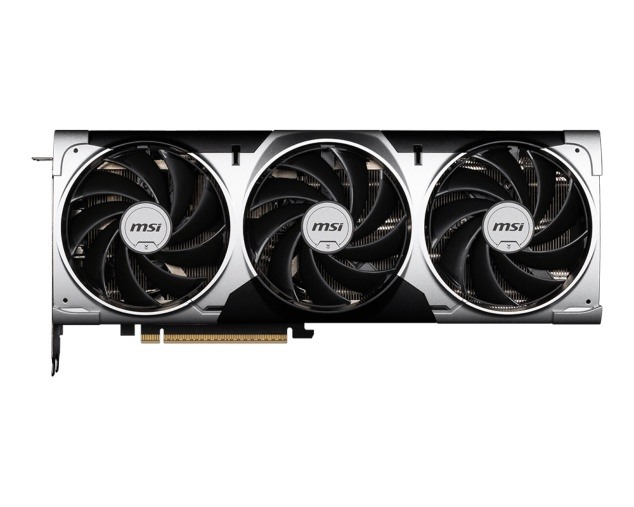
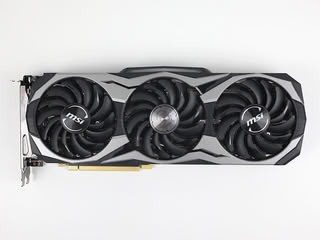
MSI RTX 2080 Ti DUKE 11G OC · fan side
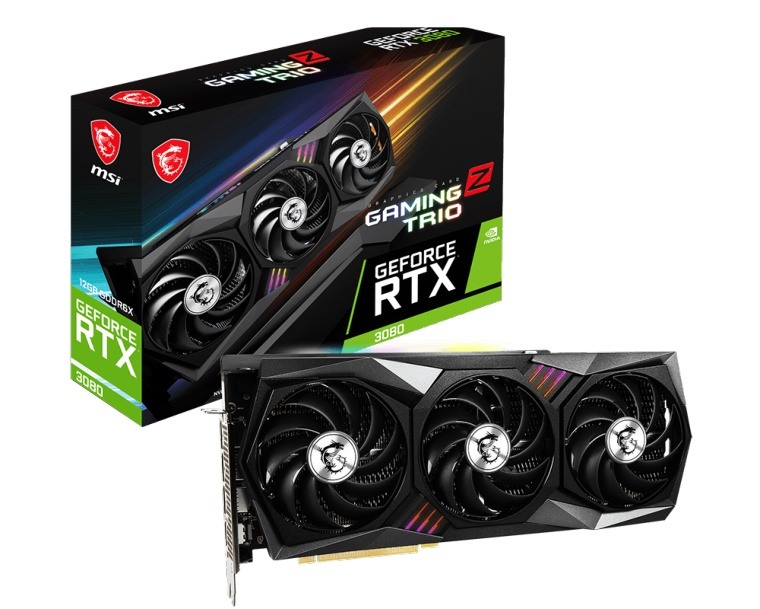
Published product image · fan side · Image source

Specifications

GPU die / architecture
TU102 · Turing
Core count
4,352 CUDA cores
GPU base clock
1,350 MHz (GPU baseline)
GPU boost / game clock
1,665 MHz
Memory capacity / type
11 GB GDDR6
Memory clock (physical)
1,750 MHz
Memory data rate (effective)
14 Gb/s per pin
Memory bus width
352-bit
Memory bandwidth (theoretical)
616 GB/s
PCIe interface
PCIe 3.0 ×16
Published board power
260 W (MSI)
Auxiliary PCIe power sockets
2 × 8-pin
Recommended system PSU
650 W
Card length
314 mm
Card dimensions (L × H × thickness)
314 × 120 × 50 mm
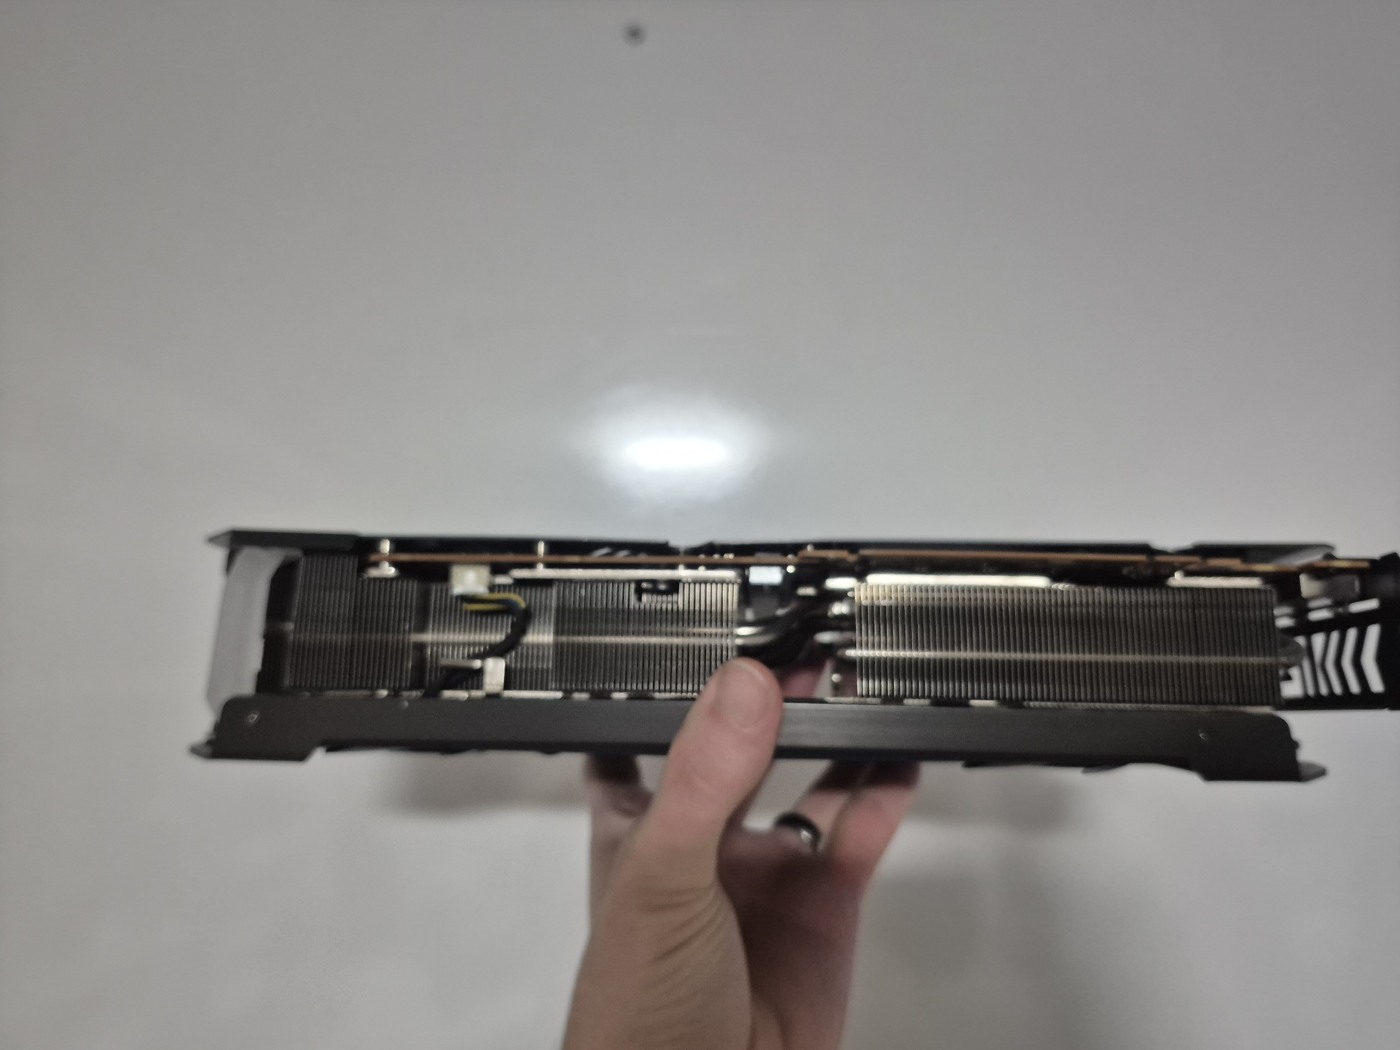
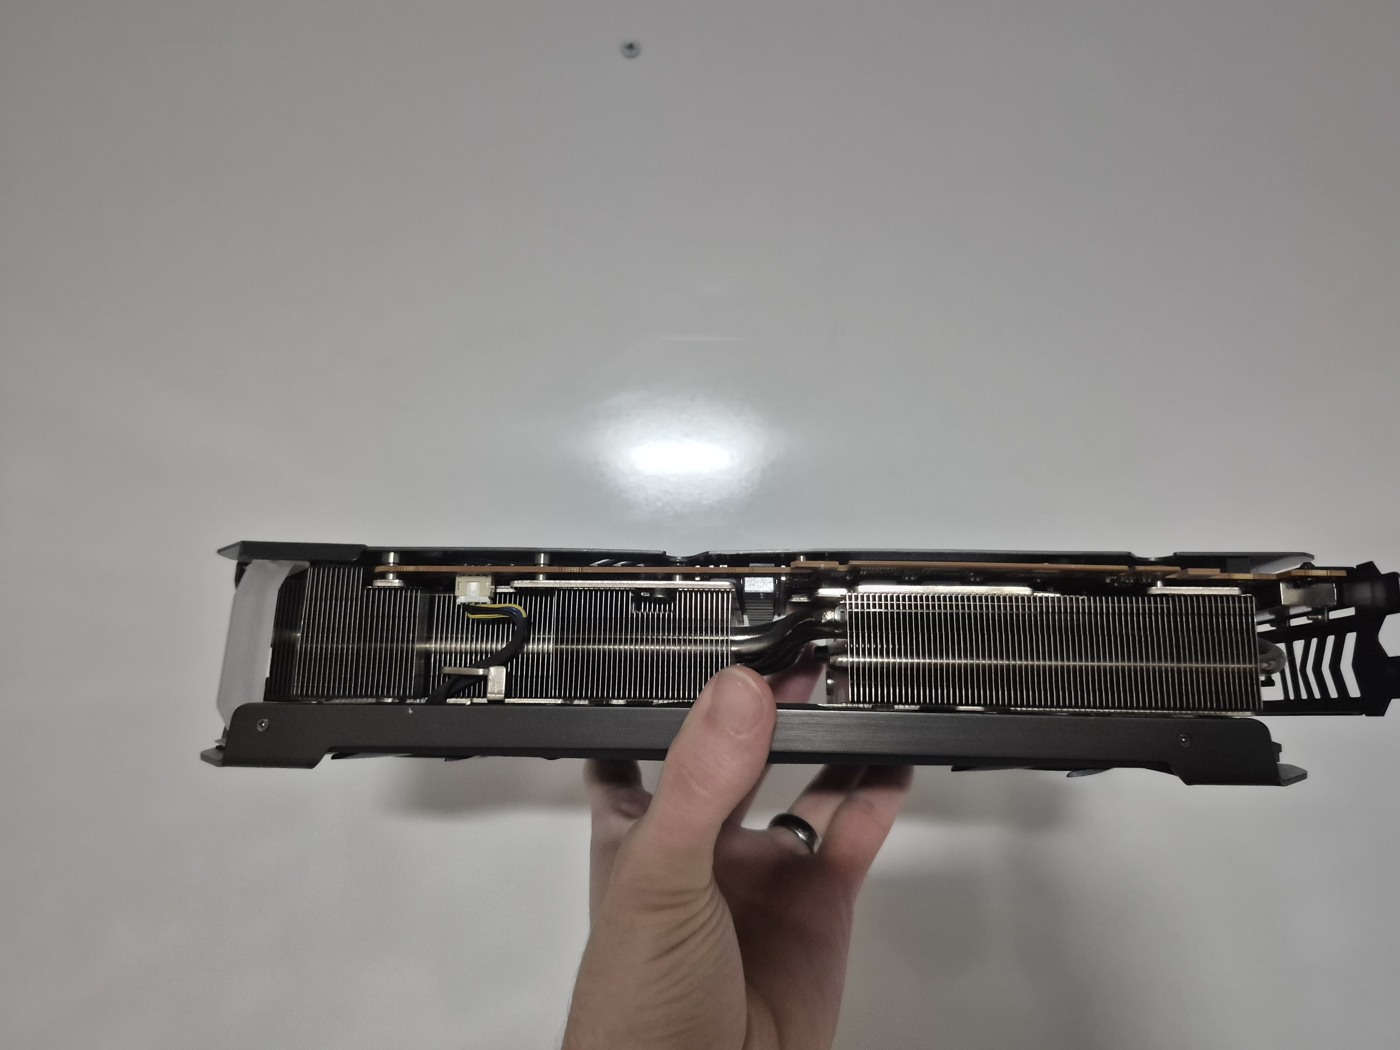
Slot clearance required
3 slots of clearance (50 mm)
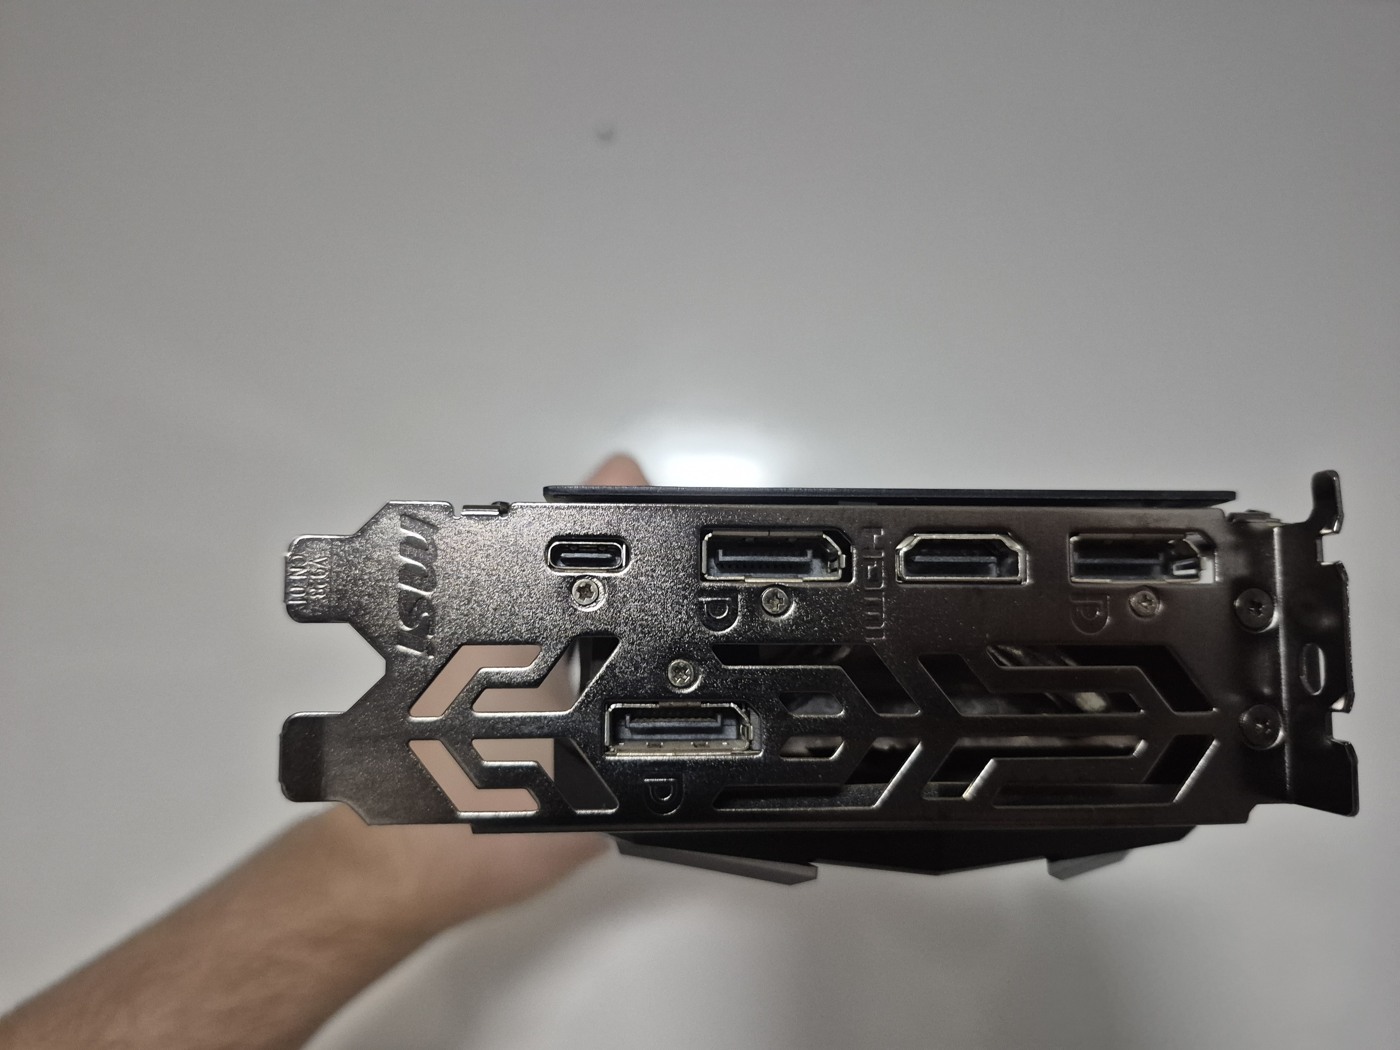
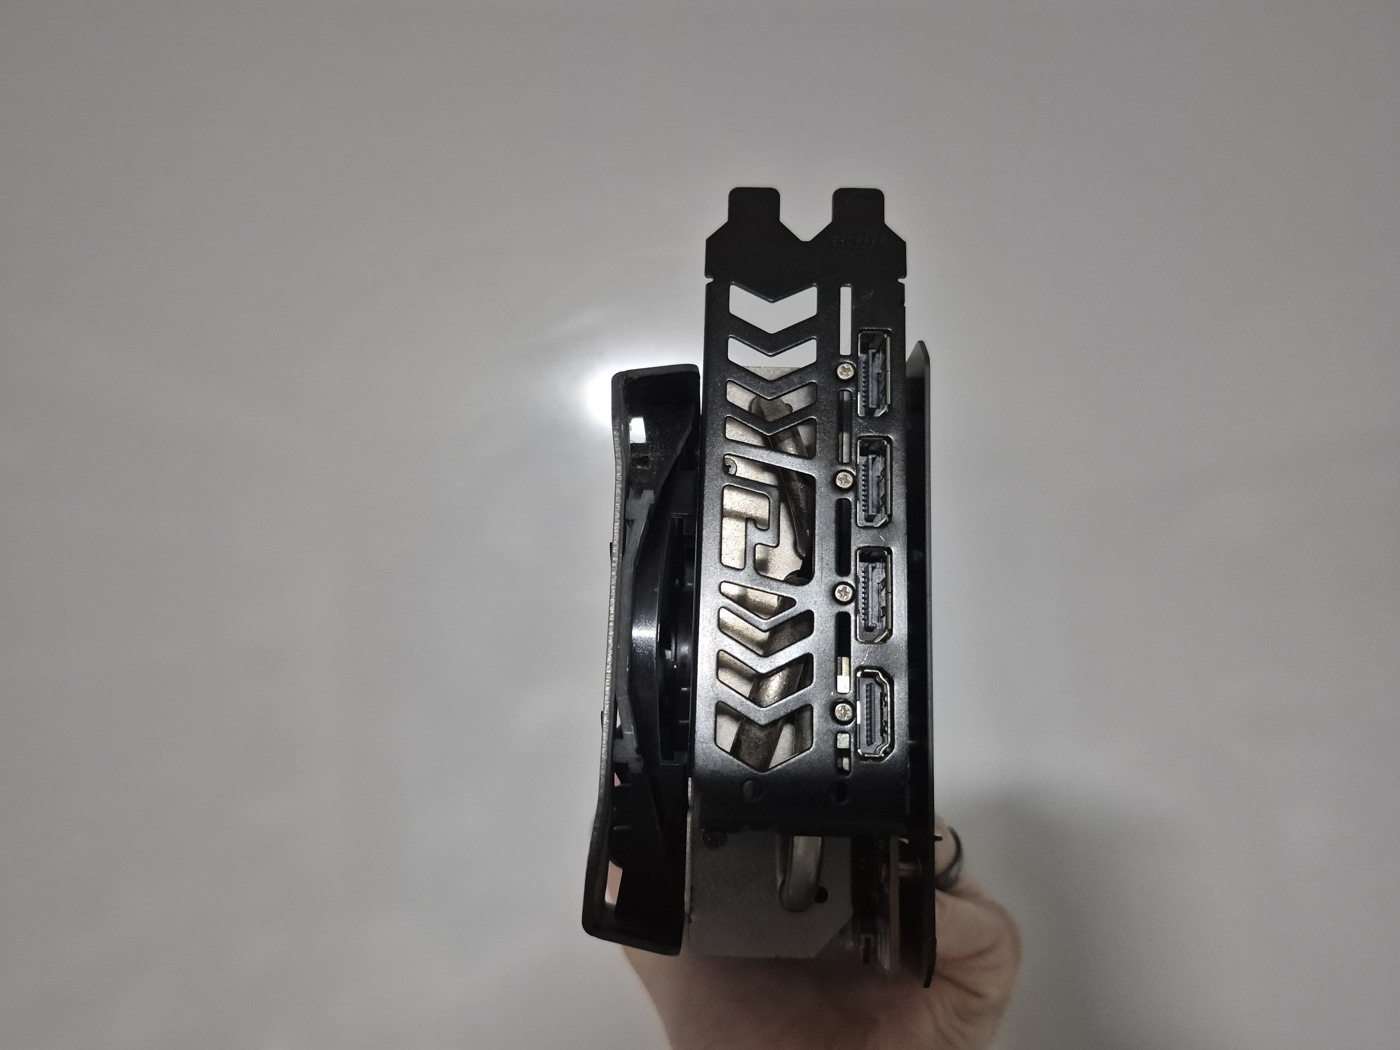
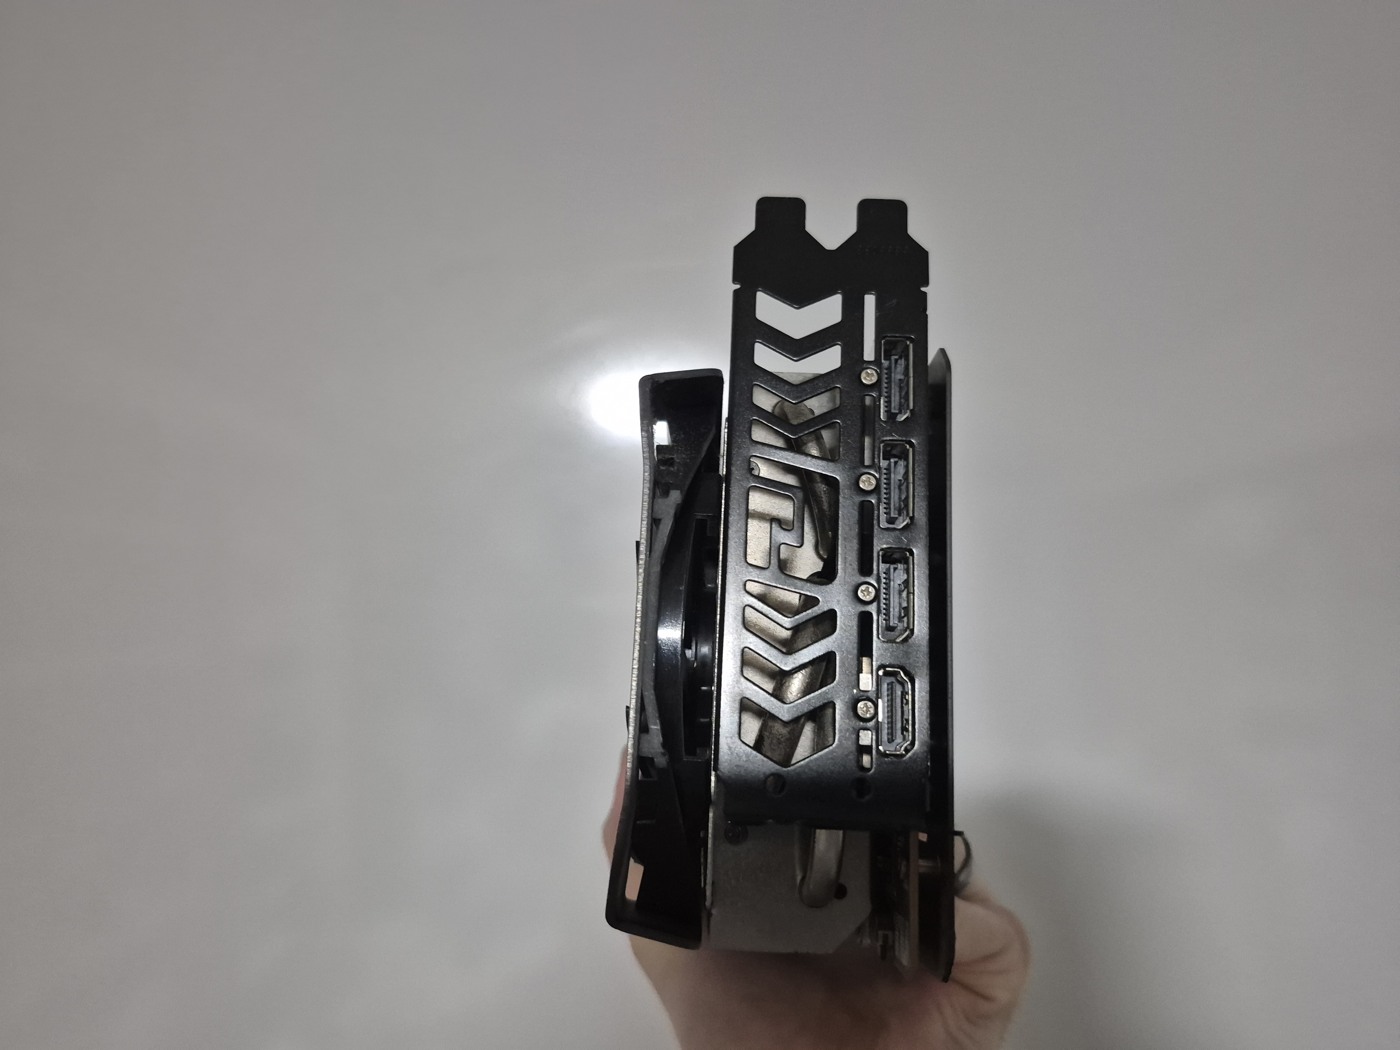
Display outputs
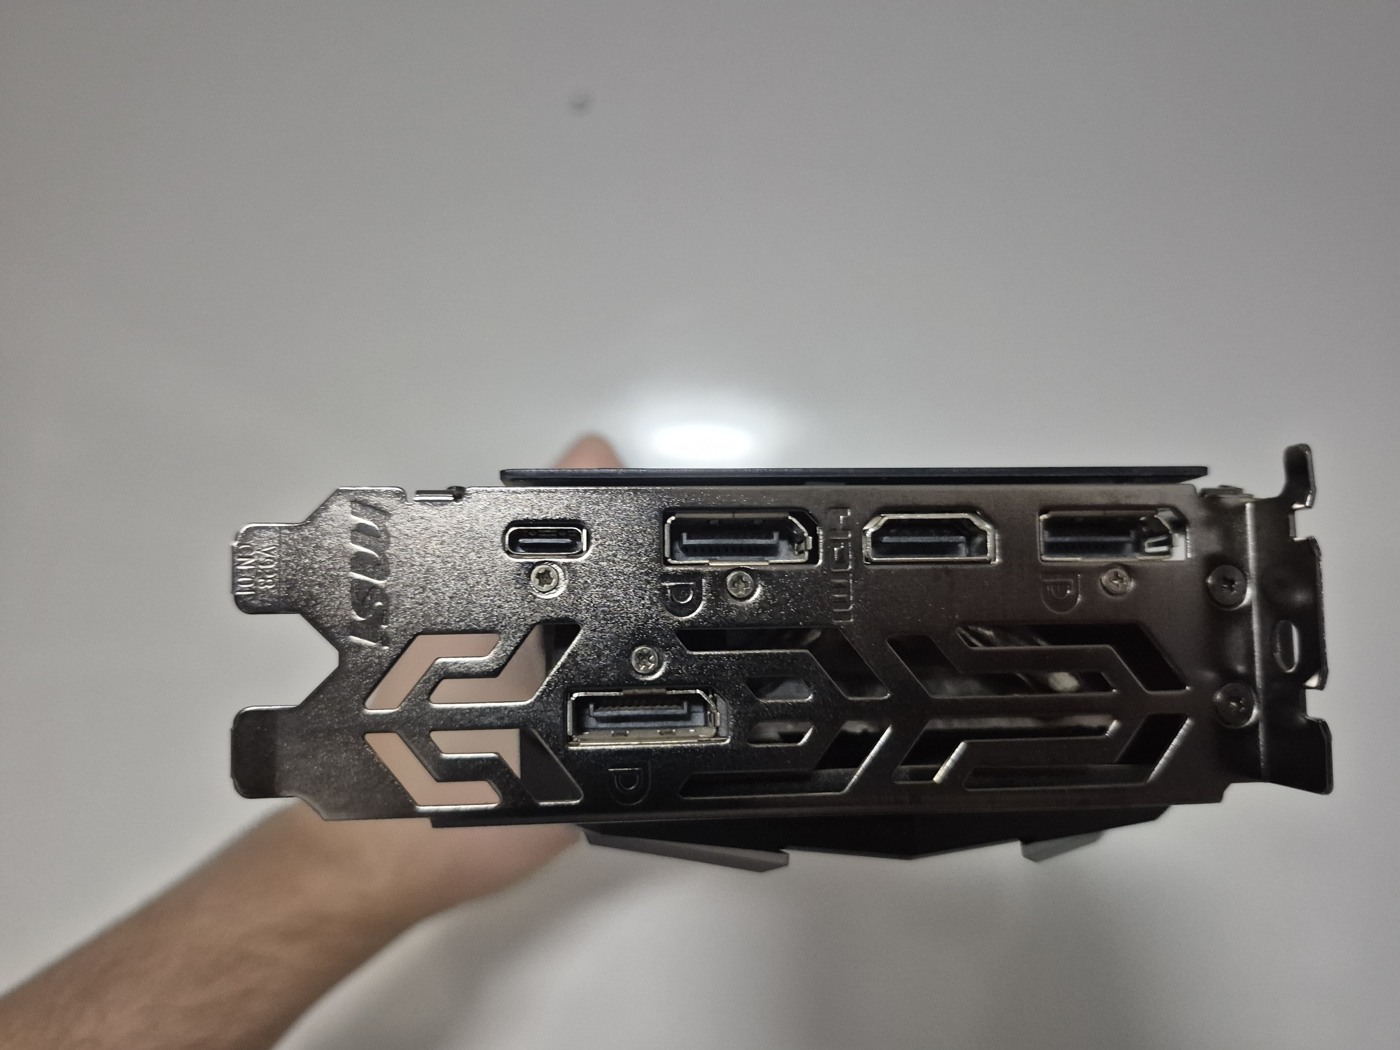
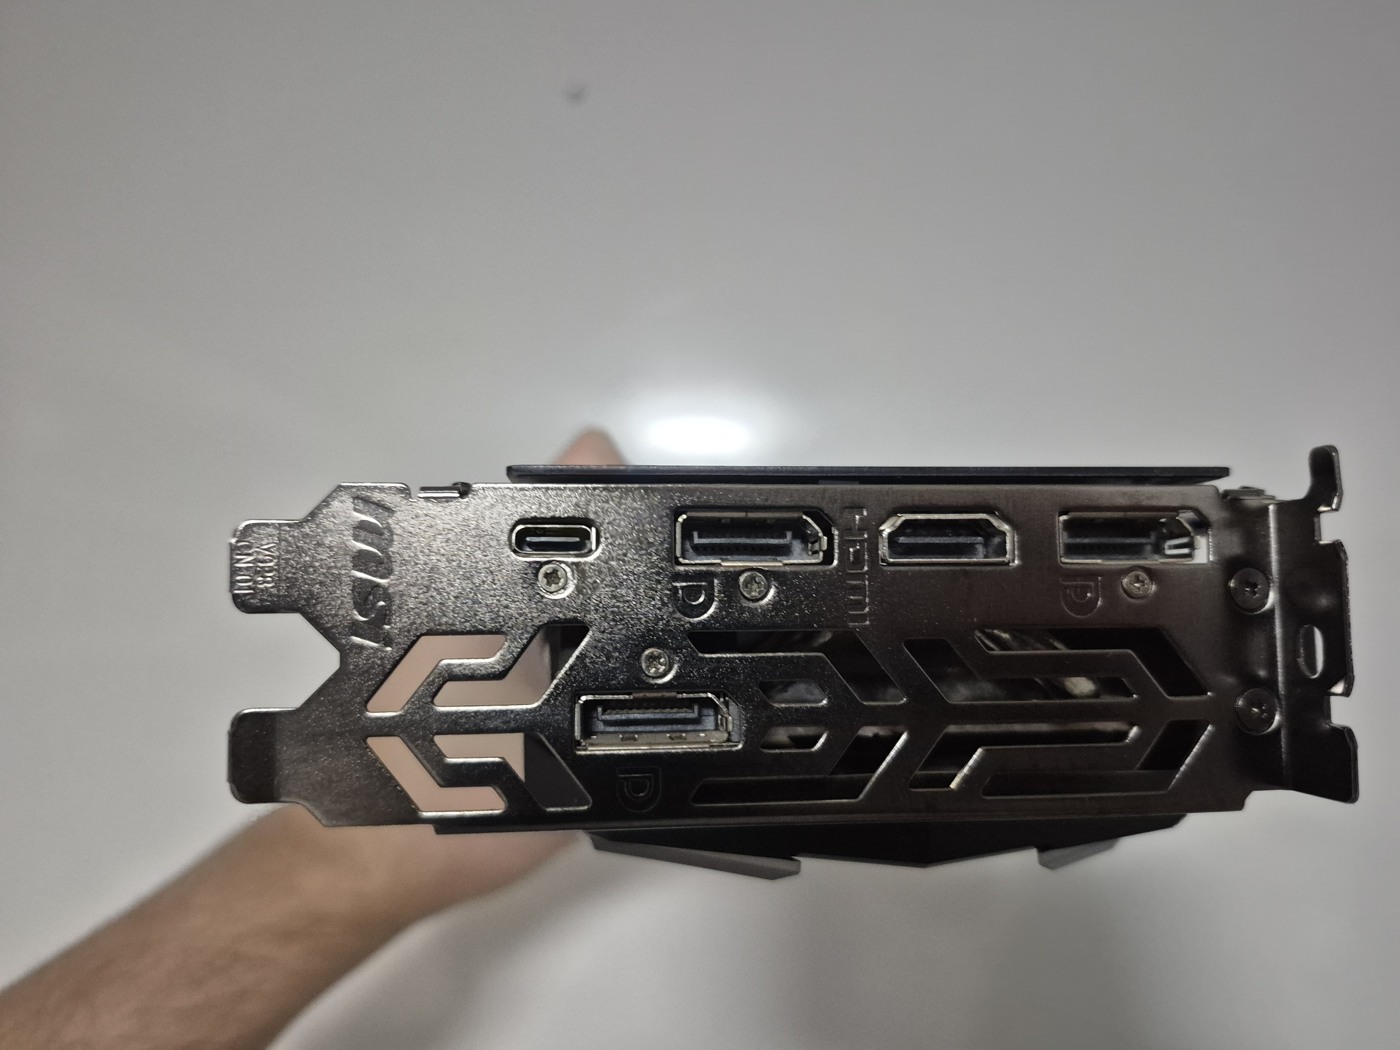
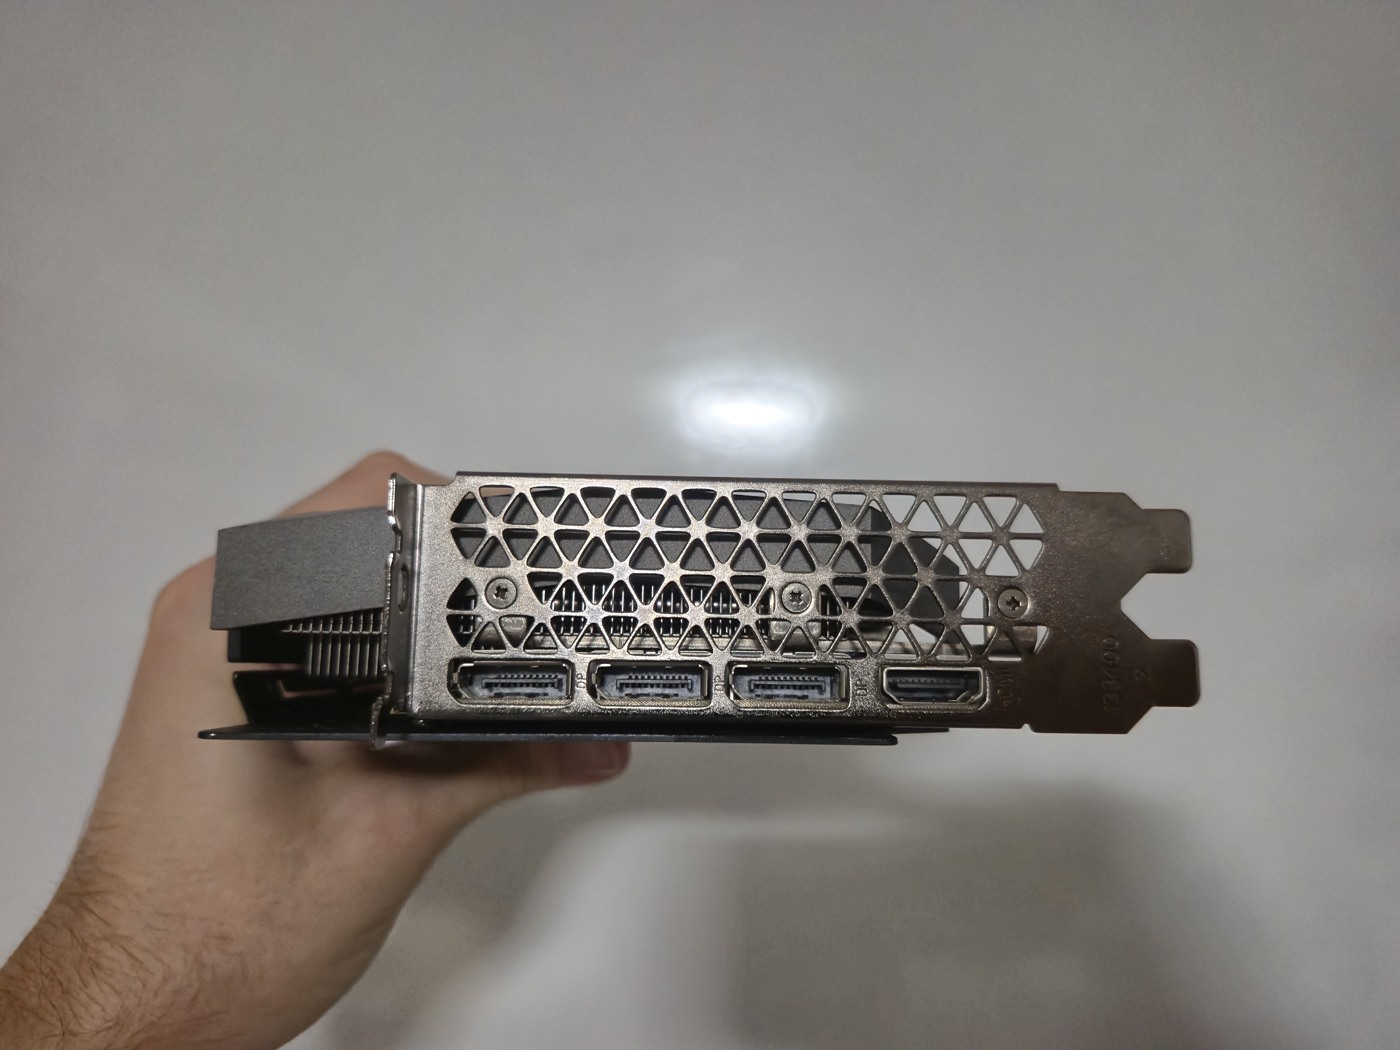
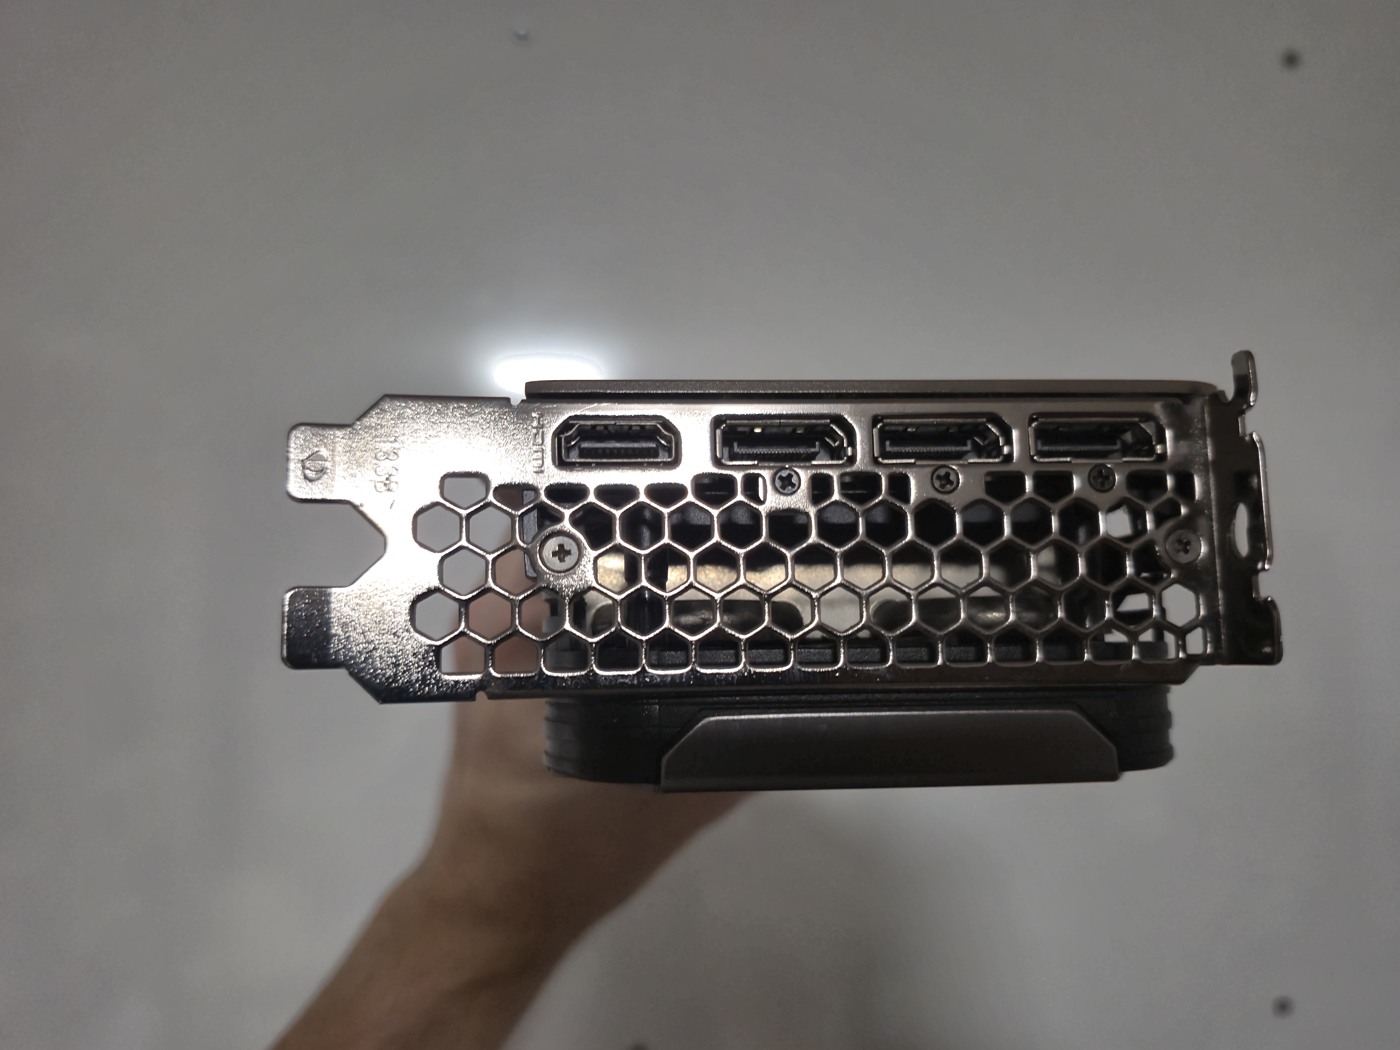
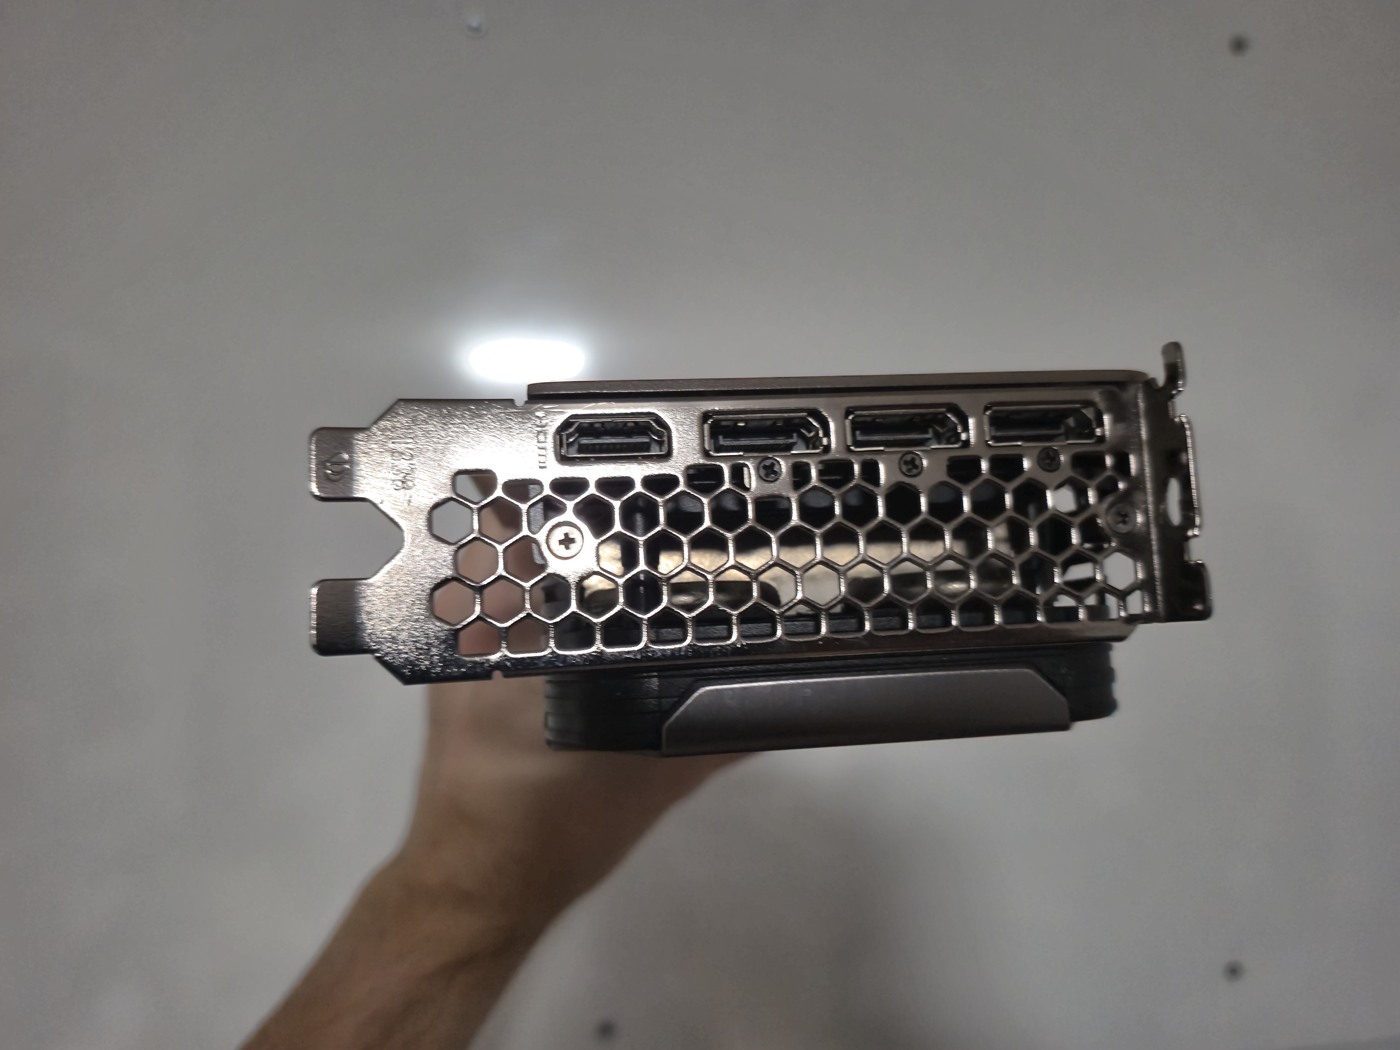
3 × DisplayPort 1.4a + 1 × HDMI 2.0b + 1 × USB-C (VirtualLink)

GPU baseline figures are not board-specific ratings. Slot clearance is the space needed for the cooler. The recommended power supply rating is for the whole system.

Sources: Manufacturer specifications · TechPowerUp GPU baseline
Measured result · 2560 × 1440

Measured power is reported by the driver. Measured power, the logged power limit, and the published board power rating are separate values.
Run timeFurMark scoreFurMark average FPSValley average FPSFurMark peak °CValley peak °CFurMark median MHzFurMark power W (median / peak)Logged power limit
21:02:468,750145.93159.8570.5072.901,440253.1 / 257.7260 W

Interactive measurements

Click a chart to enlarge it. Hover to display a recorded value and click to pin it. Drag or scroll to zoom.

Benchmark duration is the scoring time reported by the application. Sensor recording includes startup and shutdown samples. Video playback has a separate timeline.

Full session · 277.50 s sensor recording

From the first to the last sample: baseline, FurMark 2, cooldown, UNIGINE Valley, and final cooldown.

GPU temperature · full session · °C

FurMark 2UNIGINE Valley47546169760 s69 s139 s208 s278 s21:02:46

● 21:02:46

FurMark 2 · time-series charts · 60.01 s benchmark / 65.04 s sensor recording

FurMark 2 · Benchmark-reported duration: 60.01 s. Sensor recording: 65.04 s. The horizontal axis starts at the first sensor sample.

GPU temperature · °C

47546067730 s16 s33 s49 s65 s21:02:46

● 21:02:46

GPU clock · MHz

1605228851,2481,6100 s16 s33 s49 s65 s21:02:46

● 21:02:46

Memory clock (driver reading) · MHz

01,9483,8965,8447,7910 s16 s33 s49 s65 s21:02:46

● 21:02:46

Driver-reported power · W

0721442162880 s16 s33 s49 s65 s21:02:46

● 21:02:46

Fan 1 speed · RPM

04048081,2121,6160 s16 s33 s49 s65 s21:02:46

● 21:02:46

Fan 2 speed · RPM

04058111,2161,6220 s16 s33 s49 s65 s21:02:46

● 21:02:46

GPU utilization · %

02856841120 s16 s33 s49 s65 s21:02:46

● 21:02:46

UNIGINE Valley · time-series charts · 188.58 s benchmark / 192.01 s sensor recording

UNIGINE Valley · Benchmark-reported duration: 188.58 s. Sensor recording: 192.01 s. The horizontal axis starts at the first sensor sample.

GPU temperature · °C

55606570750 s48 s96 s144 s192 s21:02:46

● 21:02:46

GPU clock · MHz

1026141,1251,6362,1480 s48 s96 s144 s192 s21:02:46

● 21:02:46

Memory clock (driver reading) · MHz

01,9483,8965,8447,7910 s48 s96 s144 s192 s21:02:46

● 21:02:46

Driver-reported power · W

0751512263010 s48 s96 s144 s192 s21:02:46

● 21:02:46

Fan 1 speed · RPM

6251,2161,8062,3972,9880 s48 s96 s144 s192 s21:02:46

● 21:02:46

Fan 2 speed · RPM

04749481,4221,8960 s48 s96 s144 s192 s21:02:46

● 21:02:46

GPU utilization · %

02856841120 s48 s96 s144 s192 s21:02:46

● 21:02:46

UNIGINE Superposition did not run because 2560 × 1440 fullscreen mode was unavailable; no duration or chart is shown.

Test video

Test video · 1:35
Video chapters

Approximate playback positions. The video contains excerpts; these times do not correspond to the chart axis.

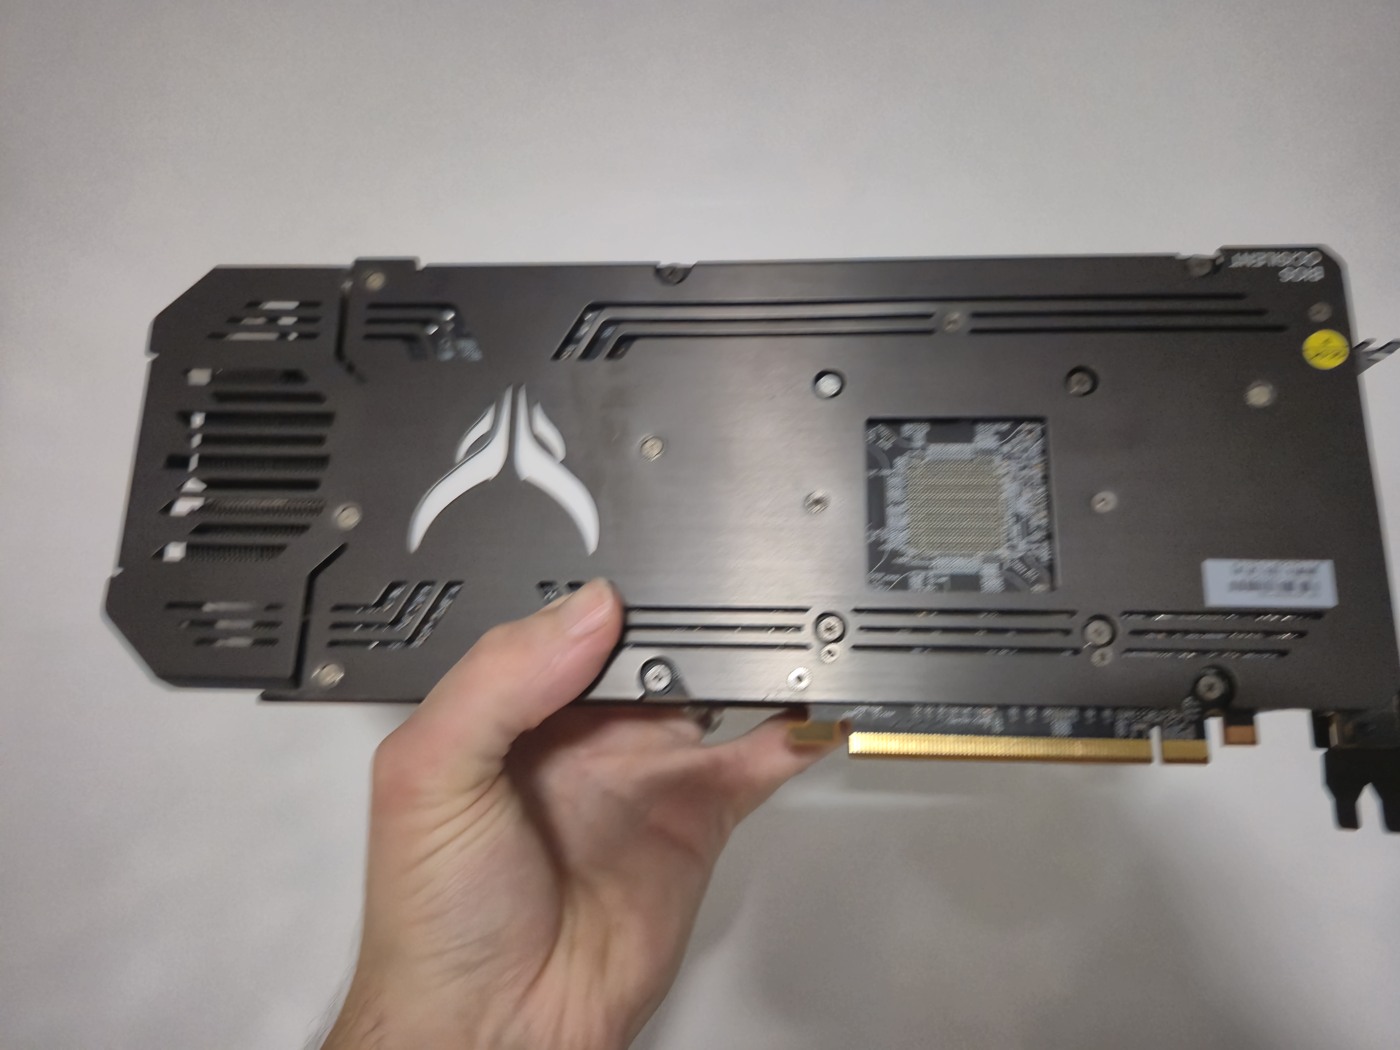
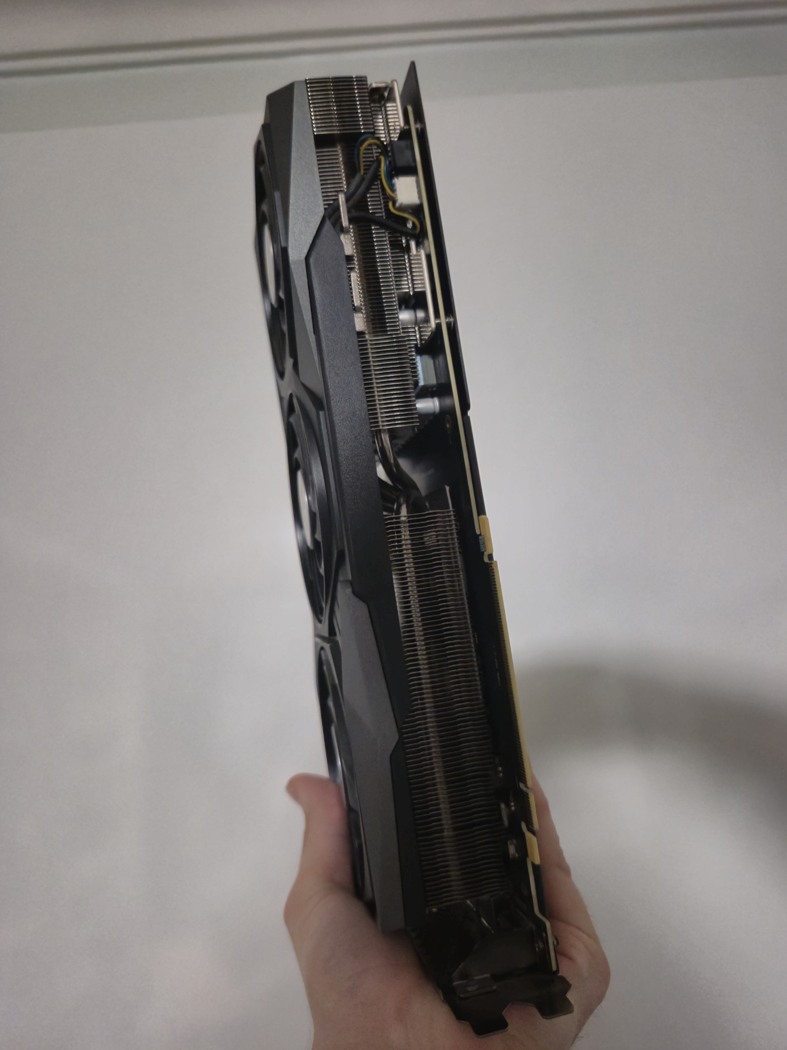
Photos of the tested card

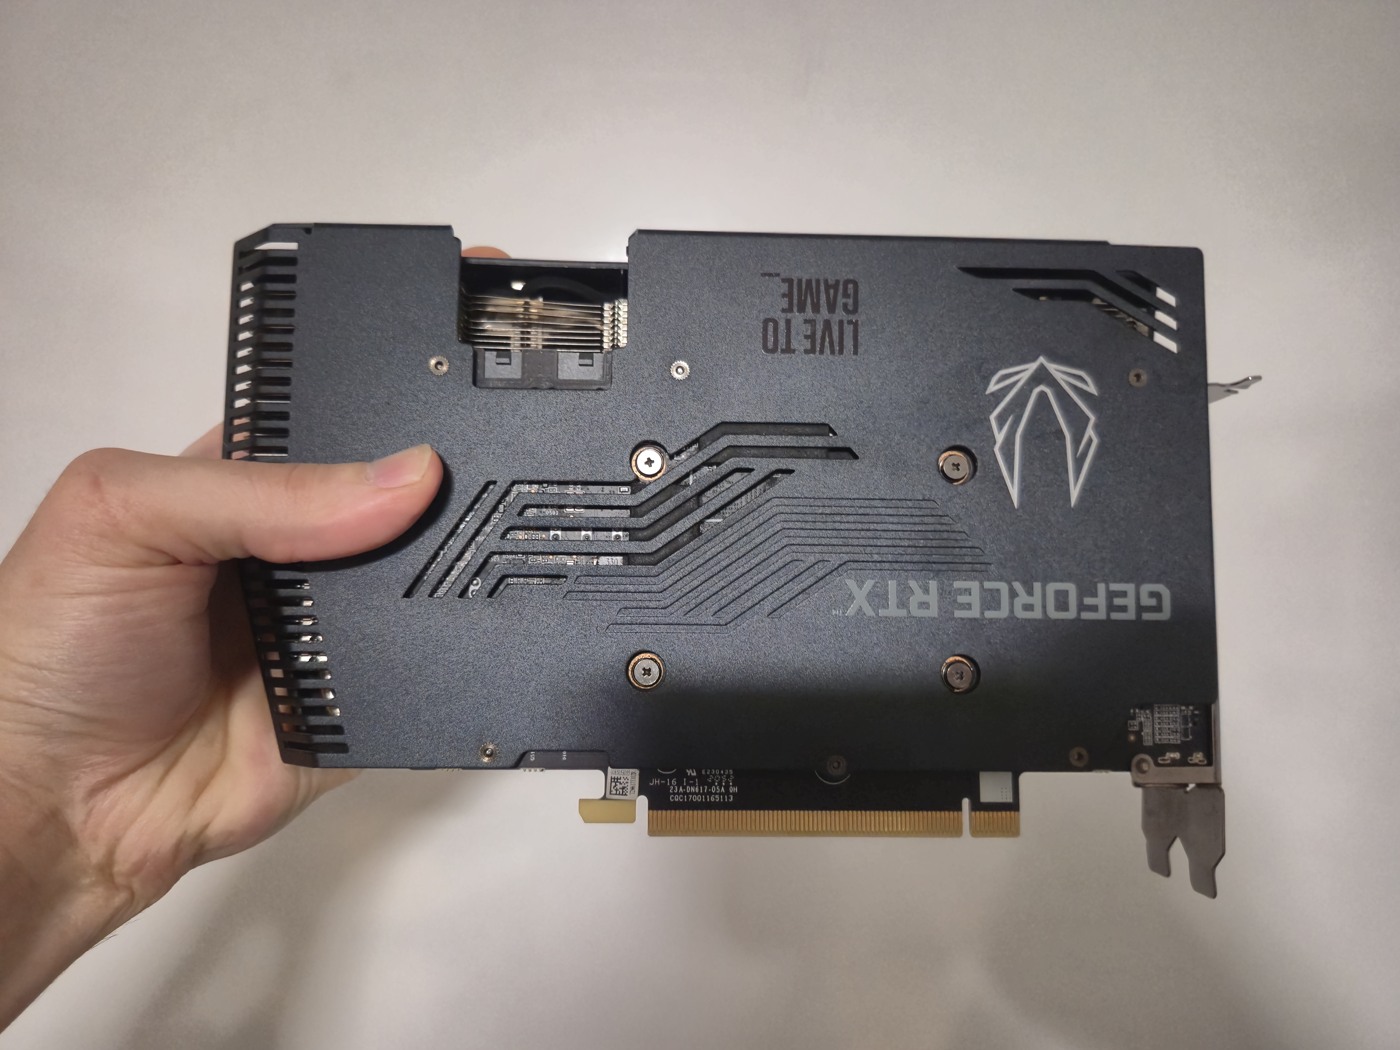
MSI RTX 2080 Ti DUKE 11G OC · 21:12:04
21:12:04
MSI RTX 2080 Ti DUKE 11G OC · 21:12:05
21:12:05
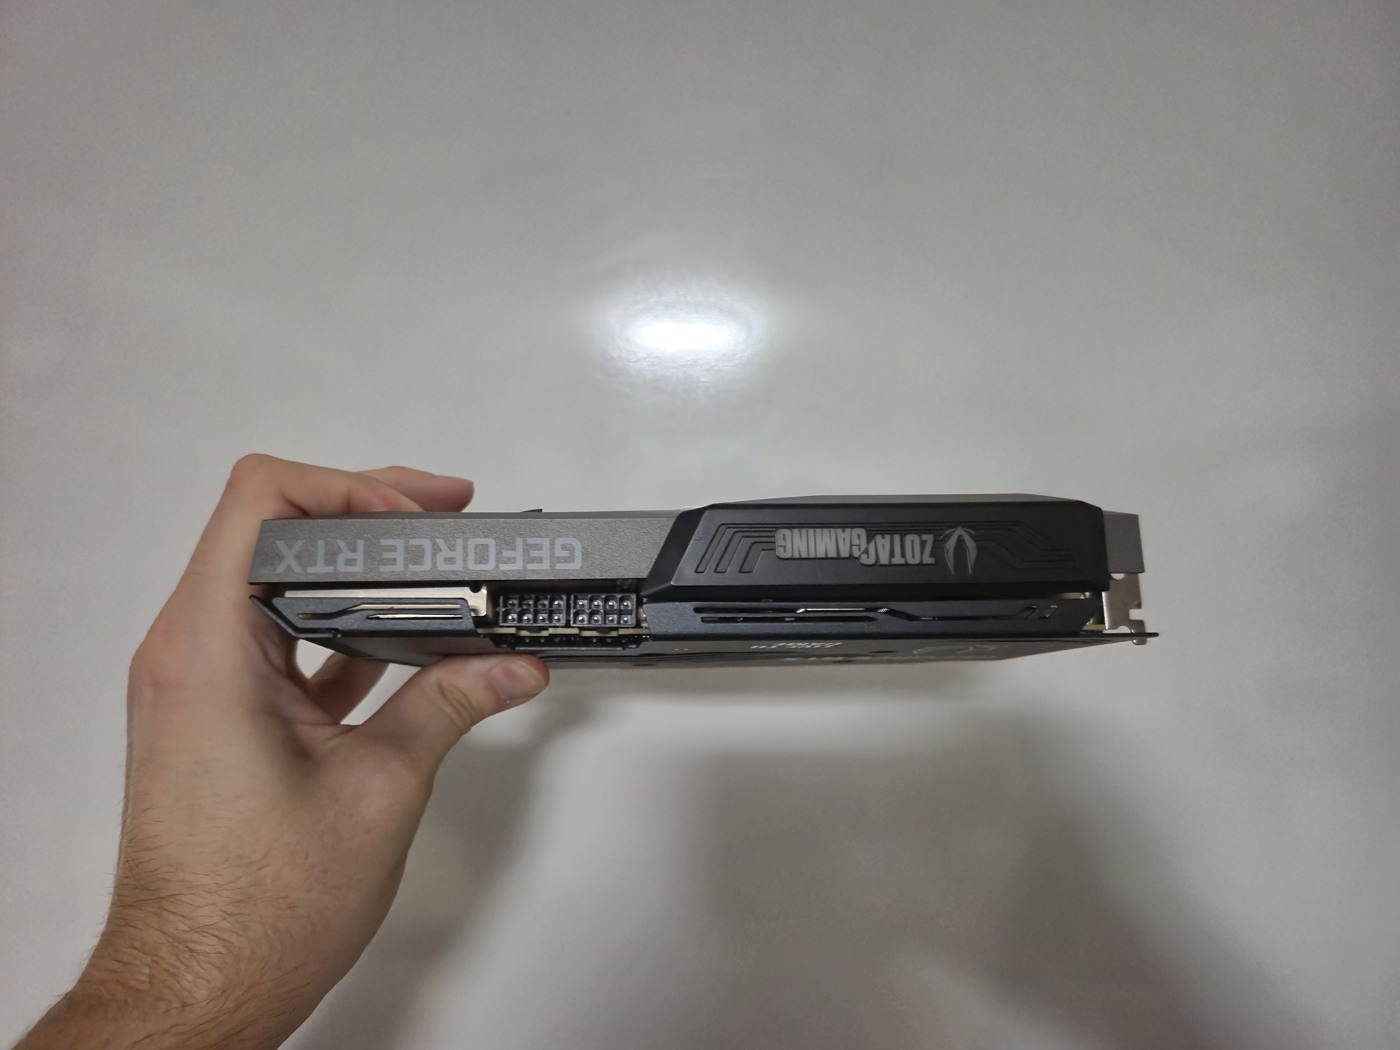
MSI RTX 2080 Ti DUKE 11G OC · 21:12:13
21:12:13
MSI RTX 2080 Ti DUKE 11G OC · 21:12:14
21:12:14
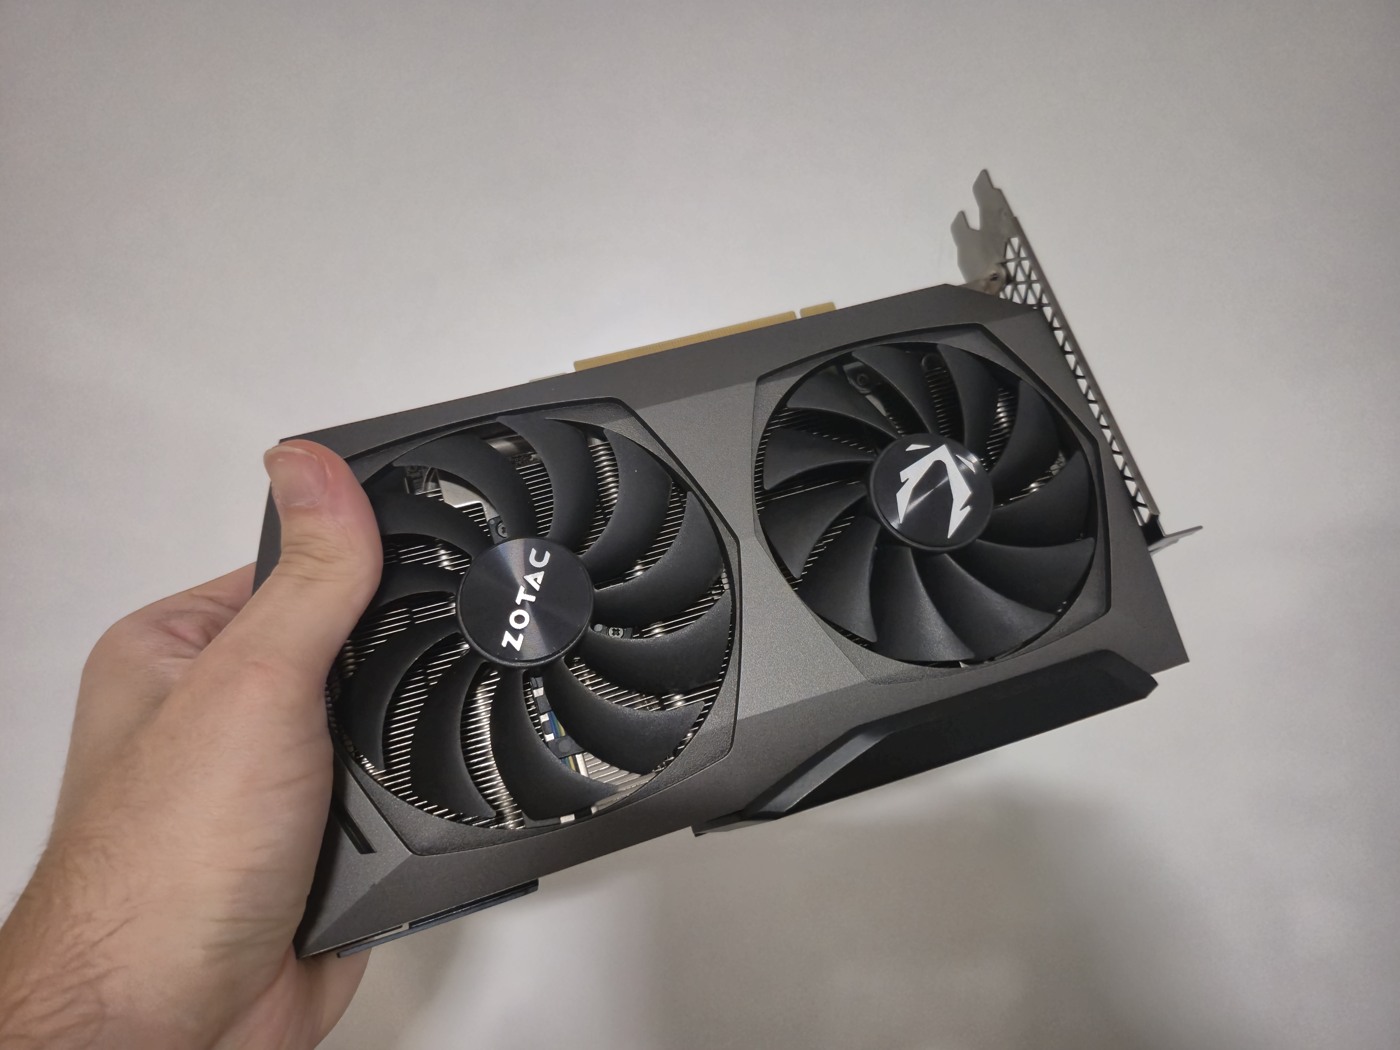
MSI RTX 2080 Ti DUKE 11G OC · 21:12:31
21:12:31
MSI RTX 2080 Ti DUKE 11G OC · 21:12:32
21:12:32
MSI RTX 2080 Ti DUKE 11G OC · 21:12:33
21:12:33
MSI RTX 2080 Ti DUKE 11G OC · 21:12:43
21:12:43
MSI RTX 2080 Ti DUKE 11G OC · 21:12:43
21:12:43
MSI RTX 2080 Ti DUKE 11G OC · 21:12:44
21:12:44
MSI RTX 2080 Ti DUKE 11G OC · 21:13:01
21:13:01
MSI RTX 2080 Ti DUKE 11G OC · 21:13:02
21:13:02
MSI RTX 2080 Ti DUKE 11G OC · 21:13:09
21:13:09